13s In National Pastime
How did Clifford Van Beek assign strikeouts to batters?
This is a harder question to resolve than you think. After doing a bit of investigation, I’m convinced that Clifford Van Beek did not use official 1930 batting statistics to assign the famous “13” strikeout play result number to his batter cards.
However, I’m not sure what he did. And I think I probably need your help in figuring this out.
The Problem
The problem is simple. Clifford Van Beek appears to have not followed any pattern in assigning play result number 13.
I know that some of you will dispute this. There are those of you I’ve been emailing about this who I’m sure will prove me wrong. I really would like you to, because I’m honestly baffled.
In order to investigate how Clifford Van Beek assigned play numbers, I have been using a spreadsheet with a complete grid of National Pastime card information. It looks something like this:
There’s a little bit more to it than just the play result numbers. I’ve also got team names, positions, a little bit of statistical information, and a few other odds and ends.
Now, for the sake of trying to figure out what Van Beek likely did, I made a few calculations based on a couple of select statistics.
I found and wrote down each player’s real life at bat, walk, and strikeout totals from 1930:
Now, I don’t think that Clifford Van Beek actually had access to that walk and strikeout information. We’ve actually already gone over the reasons why.
First of all, the official walk and strikeout information was not publicly available until after National Pastime was first publicly advertised:
Which Year Was National Pastime Based On?
1929 or 1930? If you know the history of National Pastime, you’re going to think this is a silly question. Since the beginni…
I do not believe it is possible that Clifford Van Beek had strikeout and walk information for all 288 players in order to make his cards. This information simply was not publicly available until after National Pastime’s first advertisement ran on December 11, 1930.
Note that I have been looking to see if I can prove myself wrong. I’ll let you know if I find anything in those 1930 newspapers. I do know that The Chicago Daily Tribune published more statistics through the season than I first assumed.
There is an alternative theory out there. This theory posits that Clifford Van Beek could have calculated all of the data he needed from daily boxscores. The idea is that Van Beek ran his own personal statistics service in his spare time, working hard to develop a tabletop game that was his passion.
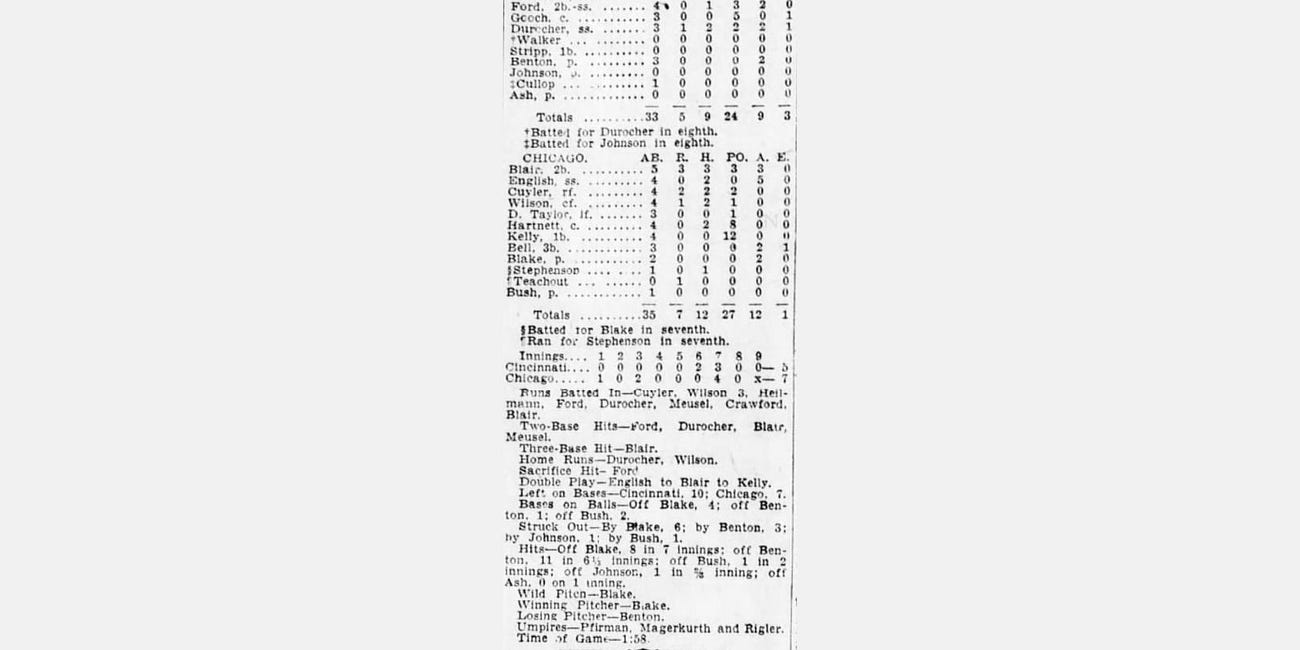
I actually do believe that Van Beek saved and collected boxscores — this seems to be the best explanation for his ability to get the original lineups almost exactly right. However, those boxscores would have told him nothing about batter strikeouts and walks. Why? Simple: that information didn’t exist in boxscores in those days:
Old Boxscores
Old Boxscores I never thought about boxscores as a changing thing until I read that book about the history of The Sporting News. In that book, I came across the following:
You’ll also note that the old boxscores give us no information about times that batters hit into double plays, which was treated as a team fielding stat in the old days. That will become important later.
Anyway, with all of this in mind, I wanted to think like Van Beek might have thought. I figured that he probably looked at the total number of at bats plus walks, used that as a sort of rudimentary estimate of plate appearances. He could then look at the number of strikeouts per each estimated plate appearance, multiply that number by 36 (or so), and get the number of 13s for each player card.
I know from talking with Bill Staffa that he probably didn’t exactly use “36” as the number to multiply by, but I figure this is close enough. I’ve also heard that Van Beek might have rounded everything up. I figured that my estimate would be a good starting point, and that any problems with this method would become obvious when we compared them with the actual results.
Here’s a feel for what the spreadsheet looks like when we do all the math:
The “EST13-r” column refers to a rounded version of the estimated number of 13s on each card. I just rounded to the nearest whole number.
So how are the results?
Well, not great. It’s a mess.
The Mess
Let me give you a few examples.
Paul Easterling had a pretty poor year for the Detroit Tigers in 1930. He played in 29 games, had 79 at bats (and 87 plate appearances), and managed to strike out 18 times. My rudimentary estimator guesses that he should have 8 “13” results on his card. By just glancing at his stats, you would think that he should have a pretty healthy amount of 13s.
Here’s his card:
Paul had 2 “13” results. Only two.
We can’t say that Easterling’s card was based on his 1929 statistics, by the way. He wasn’t in the major leagues in 1929.
Easterling was with Beaumont in the Texas League in 1929. Here are his statistics, from the 1930 Reach Guide:
Note that not even Baseball Reference has bothered to record his strikout and walk numbers for Beaumont.
Anyway, Easterling had 562 at bats and 47 walks, giving him an estimated 609 plate appearances. He struck out 99 times.
Without even doing the math, you can tell right away that he’s going to need quite a few 13s. Over 15% of his estimated plate appearances resulted in strikeouts. My estimate is that he would need about 6 “13” results on his card.
He had 2 instead.
Now, not all of Van Beek’s cards contained too few strikeout results. Some contained too many.
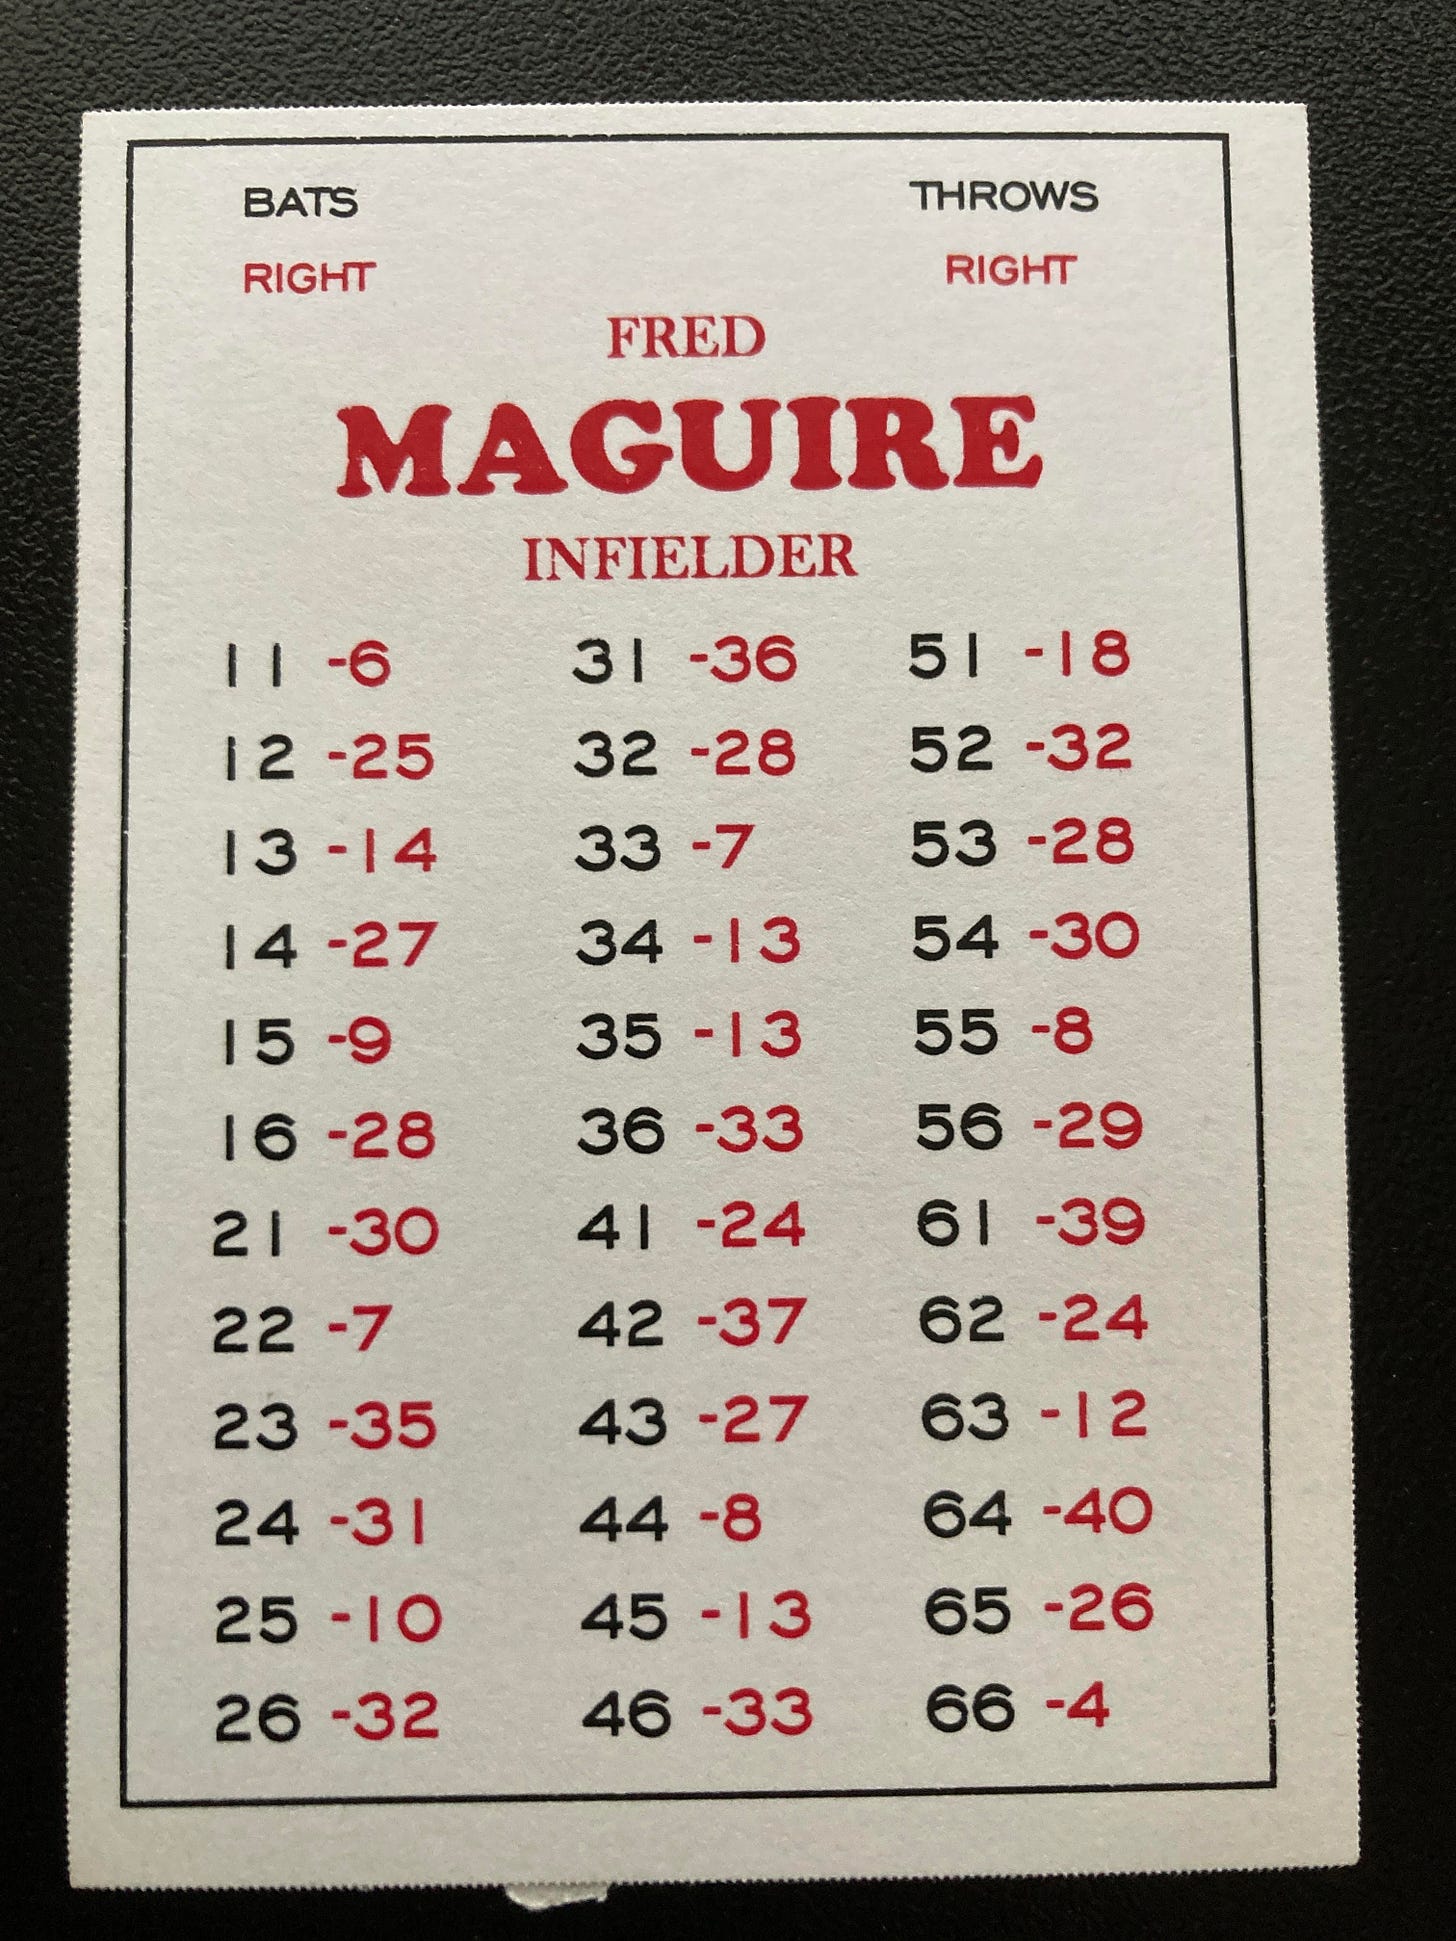
Take Fred Maguire of the Boston Braves for example. The 31-year-old Maguire played in 146 games for the Braves, recording 516 at bats, 22 strikeouts, and 20 walks. My rudimentary model estimates that Fred ought to receive 1 “13” on his card. You could argue that he ought to be bumped up to a second 13.
This is what he got:
Maguire wound up with 3 “13” results on his card.
Yes, I know what you’re thinking. There must be a mistake somewhere, right? He probably shouldn’t have a 13 on 35.
I honestly don’t know. There are a few cards where there are obviously typographical errors: James Welsh of the Braves has an “8” on dice roll 56, for example.
However, Maguire is far from the only player with a “13” on dice roll 35. 17 players share that result. And the “13” on dice roll 34 is even more common, with a whopping 42 players receiving that card. Maguire is indeed the only player with 13s on both 34 and 35, but this is not necessarily a mistake.
We’ll talk more about mistakes in a future post.
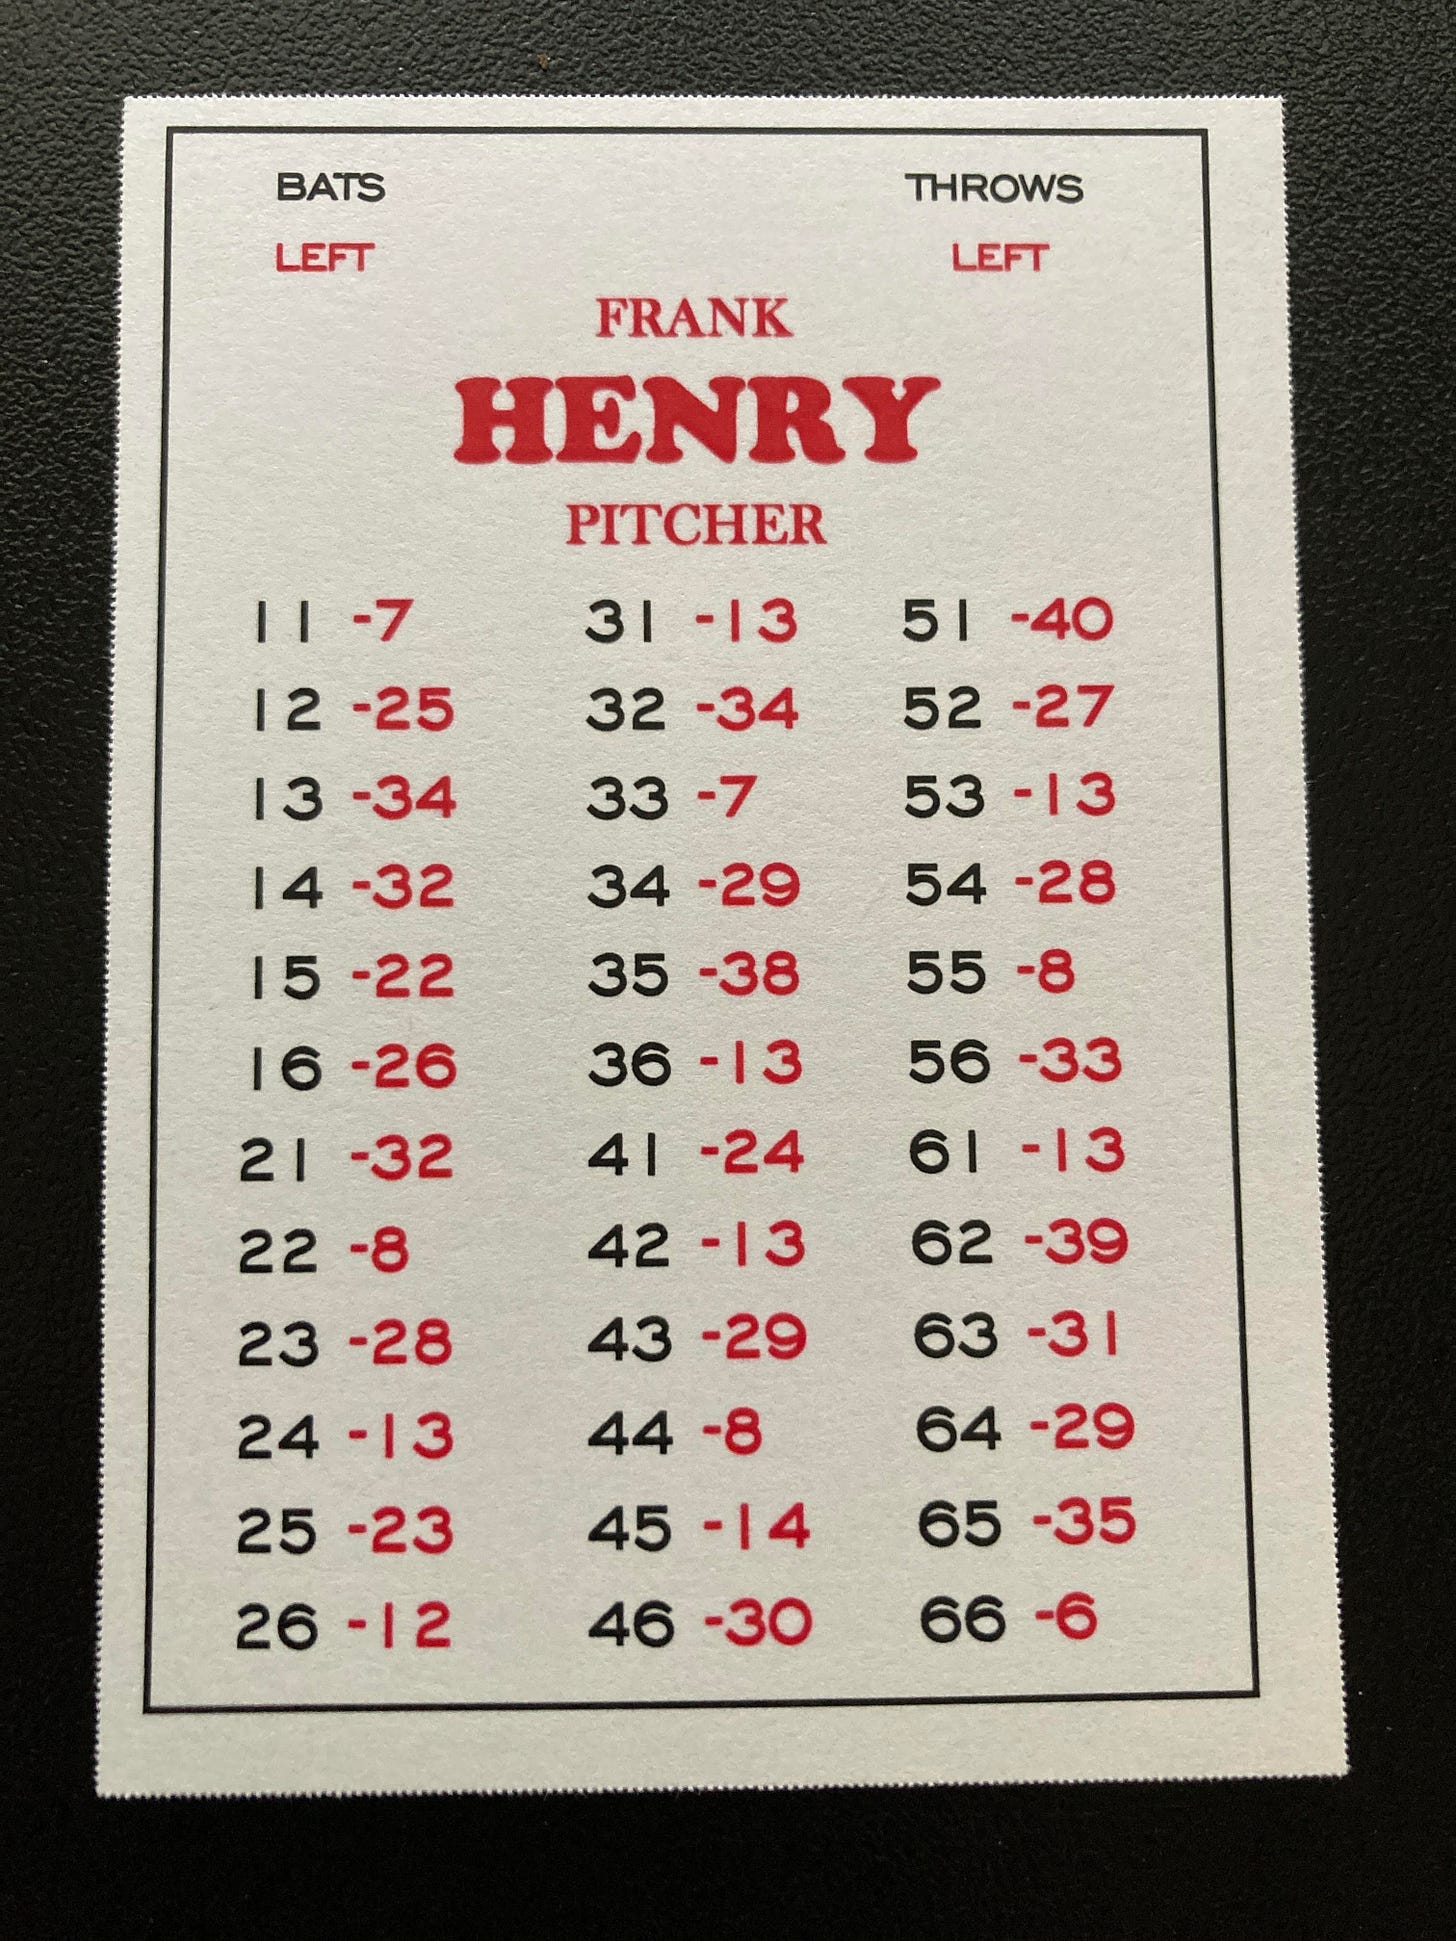
Now, the really confusing part of all of this is that Van Beek sometimes hits my model right on. Take Dutch Henry of the Chicago White Sox for example.
Dutch, a pitcher, appeared in 35 games in 1930 for the Pale Hose, gathering 51 at bats in the process. He struck out 10 times and walked 5. My estimate is that he should receive 6 “13” results on his card.
You’d think that my estimate would be off, wouldn’t you? Well, read it and weep:
That’s right: there are no fewer than 6 “13” results on Dutch’s card.
In other words: sometimes my model is right on the money, and sometimes it’s off. Sometimes we’re off by a single 13, and sometimes we’re off by two. Two pitchers are missing as many as 10 expected 13s, and two pitchers have 5 more than expected.
That makes it really difficult to figure out what Clifford Van Beek was doing. It seems that something new comes up every time I think I’ve got it figured out. And that’s why I need your help.
I’ll give you more statistics in a future post, since this one is long enough as it is. In the meantime, if you have any idea what could be going on here, please let me know.


