1908 Replay Stats
Rather than writing a single huge post that contains a game summary and the statistics, I figured it was better to break this one up into two posts. I’ll try to do that going forward.
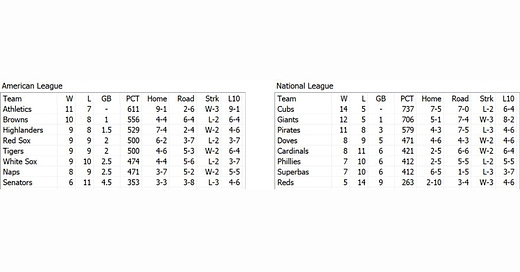
Here are the standings:
As you can see, the pennant races are just as close as they were a week ago. The Cubs aren’t quite breaking free of the contenders in the National League, and the American League is a mess that keeps getting messier.
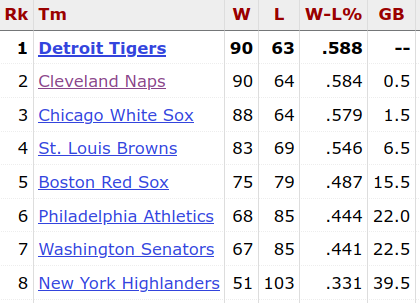
Now, I know that you guys don’t have the 1908 standings memorized. Here are the real-life American League standings:
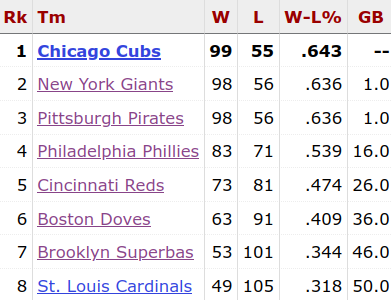
And here is the National:
The Highlanders and Athletics are playing over their heads at the moment. In contrast, the National League looks very similar to how it was in real life. Interesting how that works.
Individual Leaders
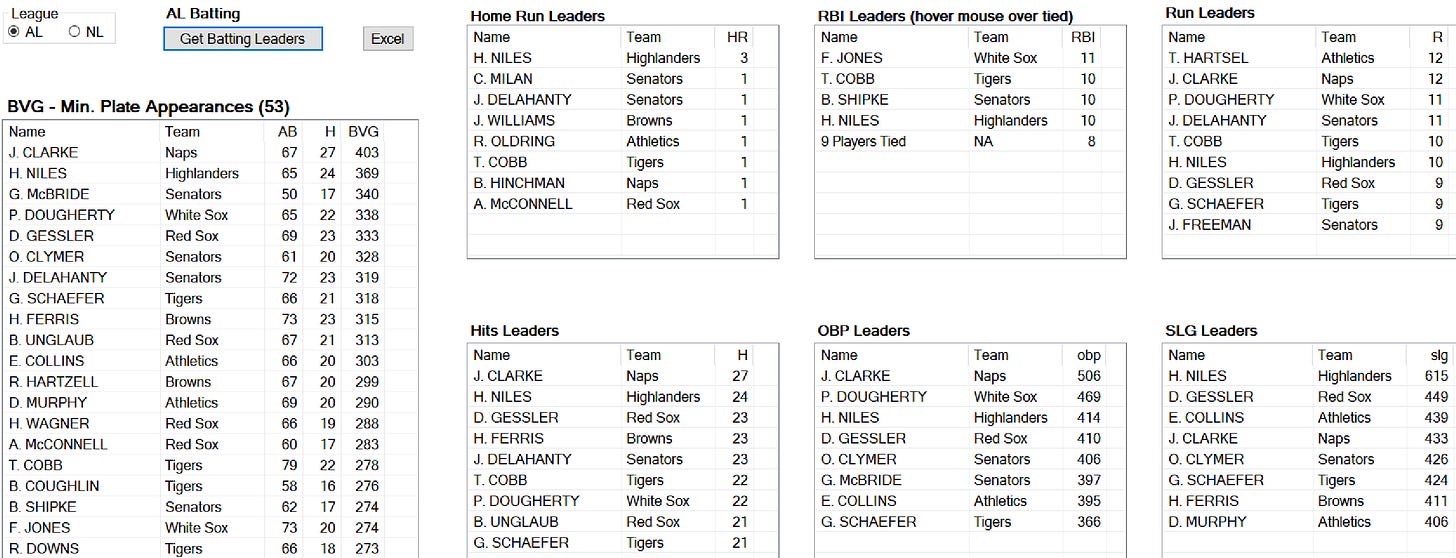
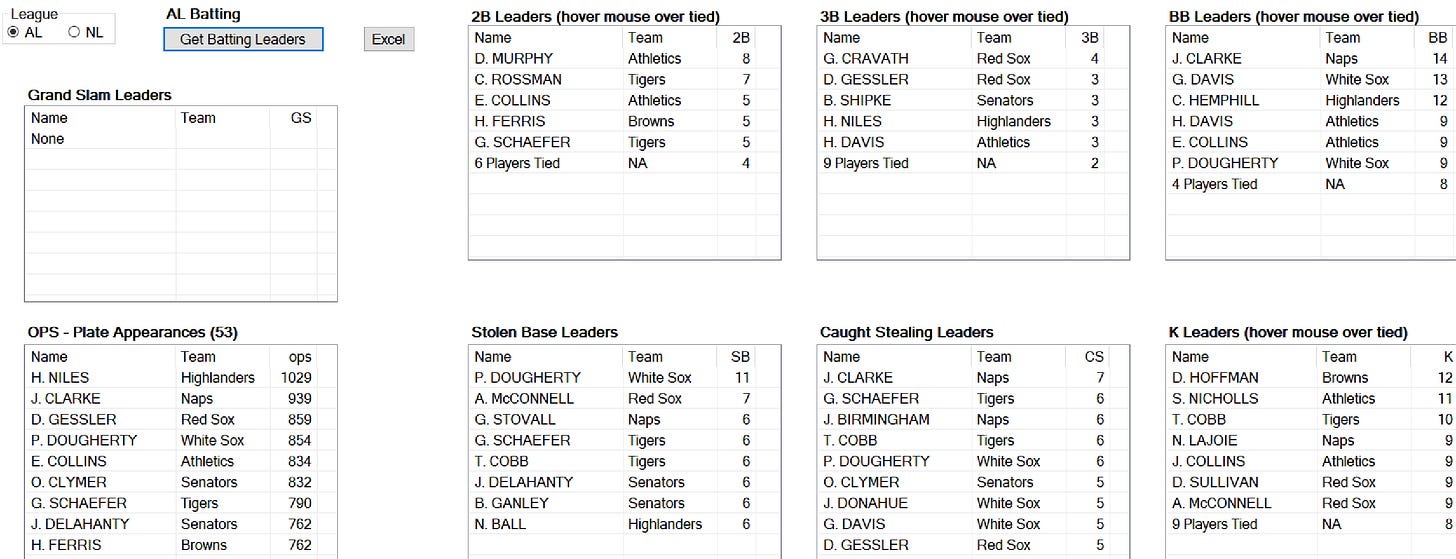
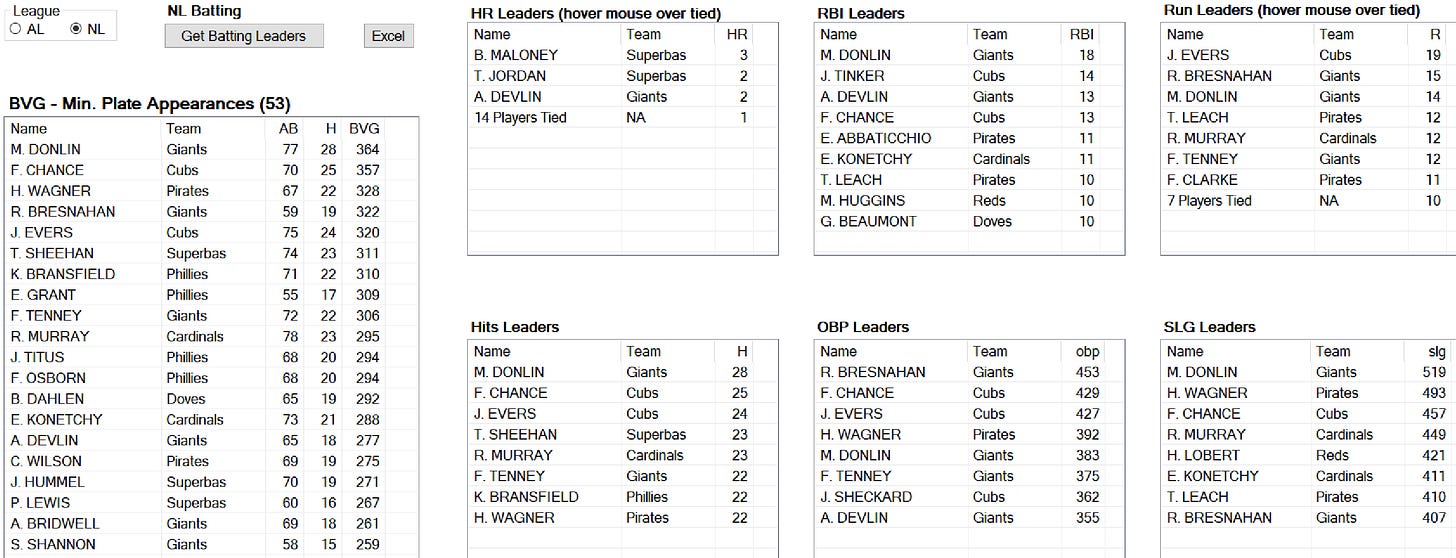
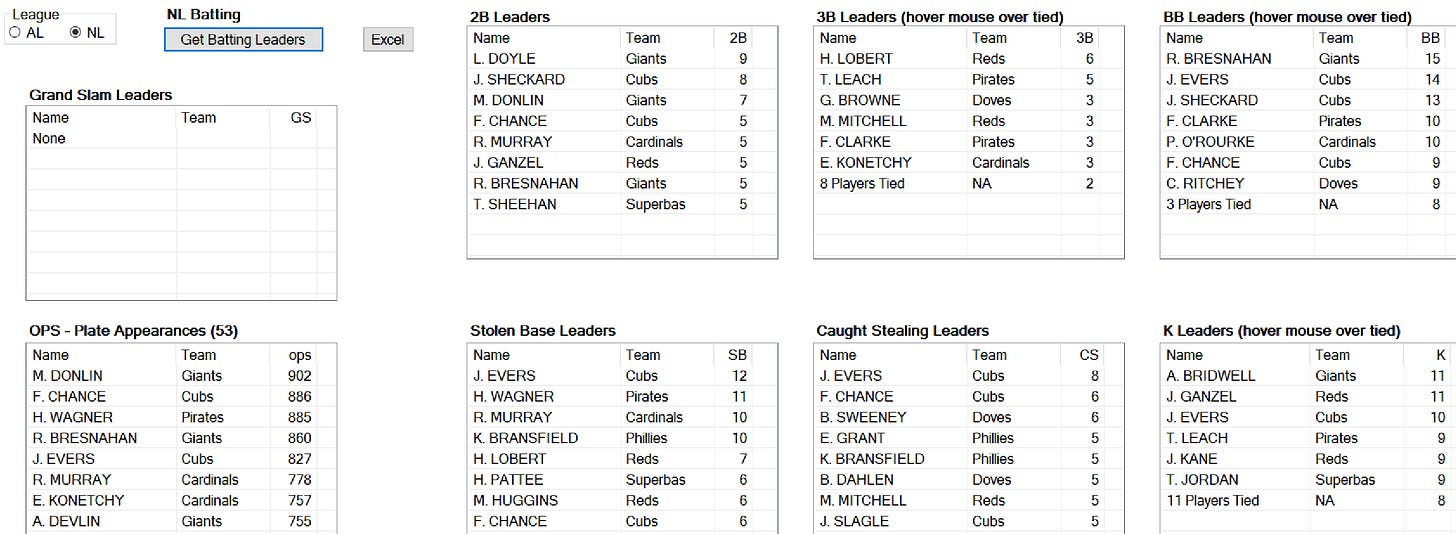
Let’s take a quick look at the batting leaders in both leagues:
I’ve included all categories that come with the game by default, though a bunch of them don’t really matter.
Josh Clarke of the Cleveland Naps is hitting .403, which is surprising. In fact, the American League in general is outhitting the National — in terms of batting average, at least.
Harry Niles, meanwhile, has edged Clarke out for the top OPS spot in the American League, which is another surprise.
This probably won’t last long. Compare that list with the real life leaders:
Honus has had a slow start to the season, but he’ll come back around.
Mike Donlin, on the other hand, is hitting well so far, as expected.
Remember that we’re only a few weeks into the season. It’s too early to make any dramatic pronouncements about accuracy or players underperforming.
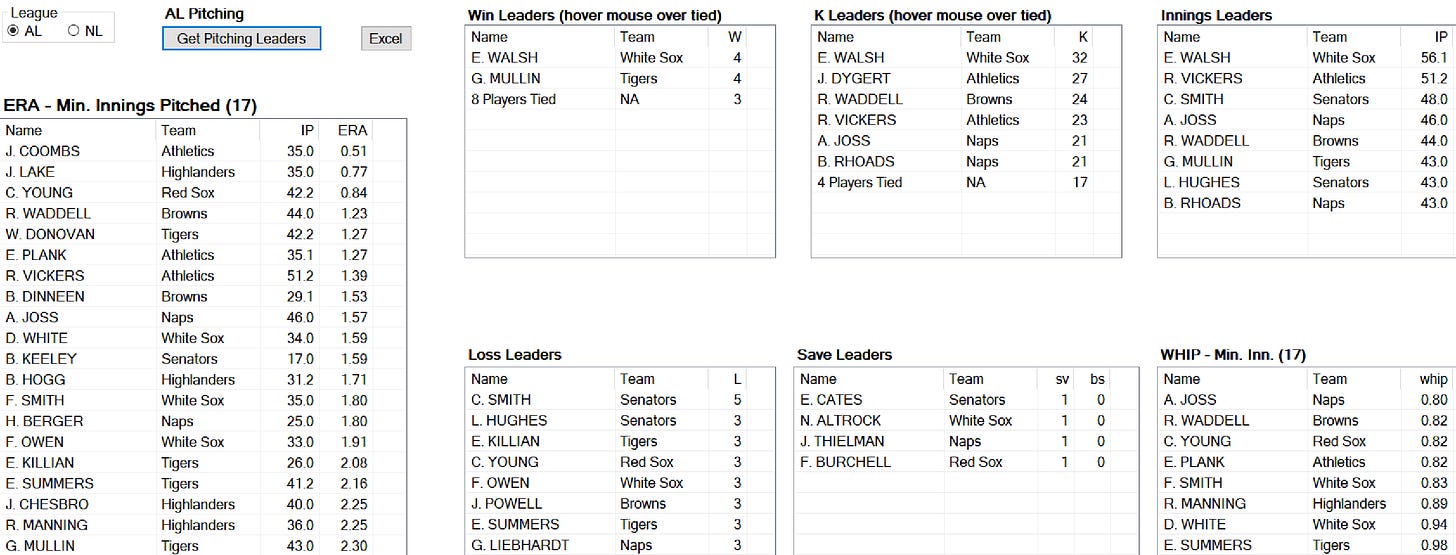
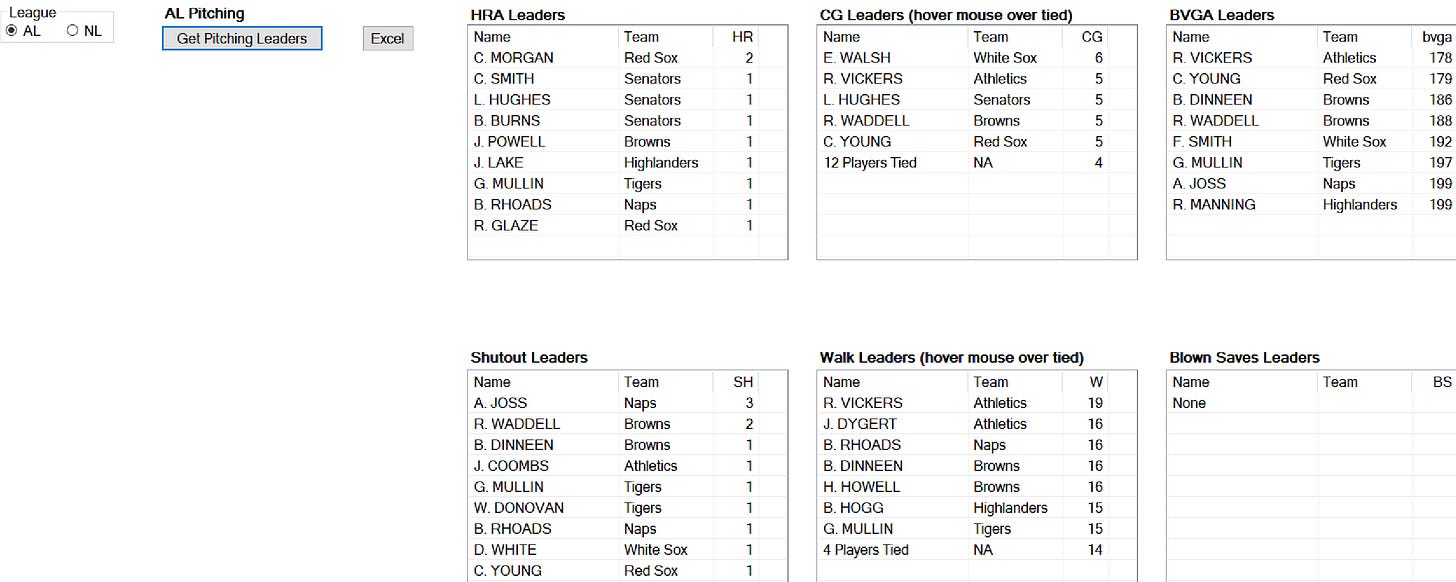
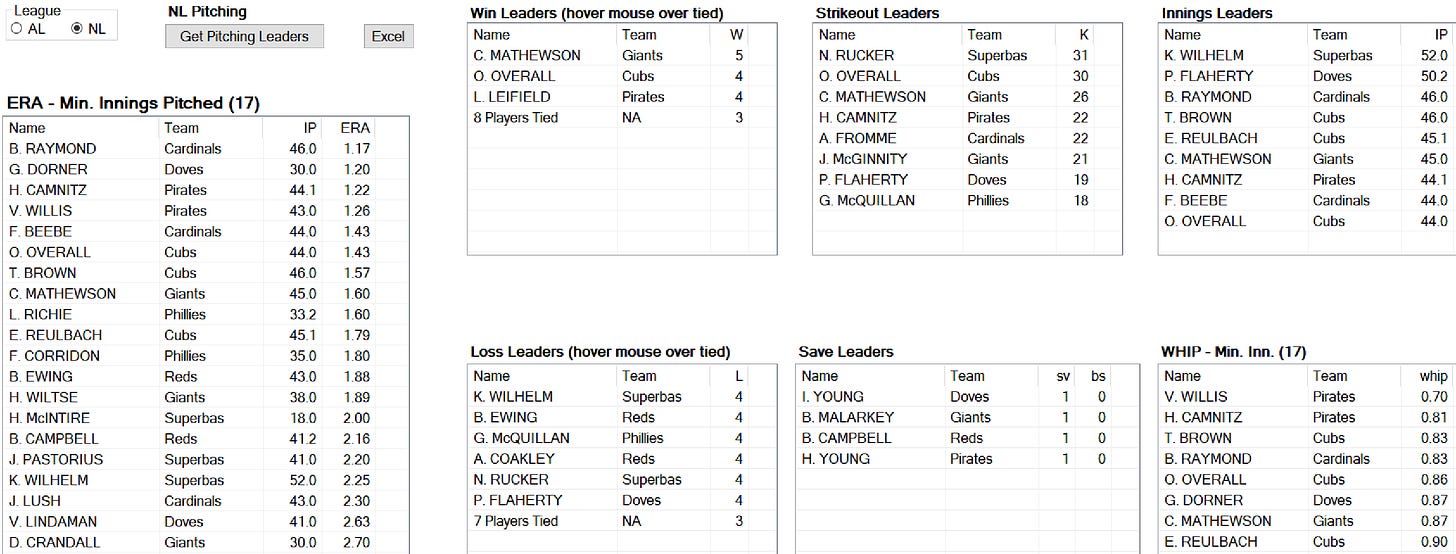
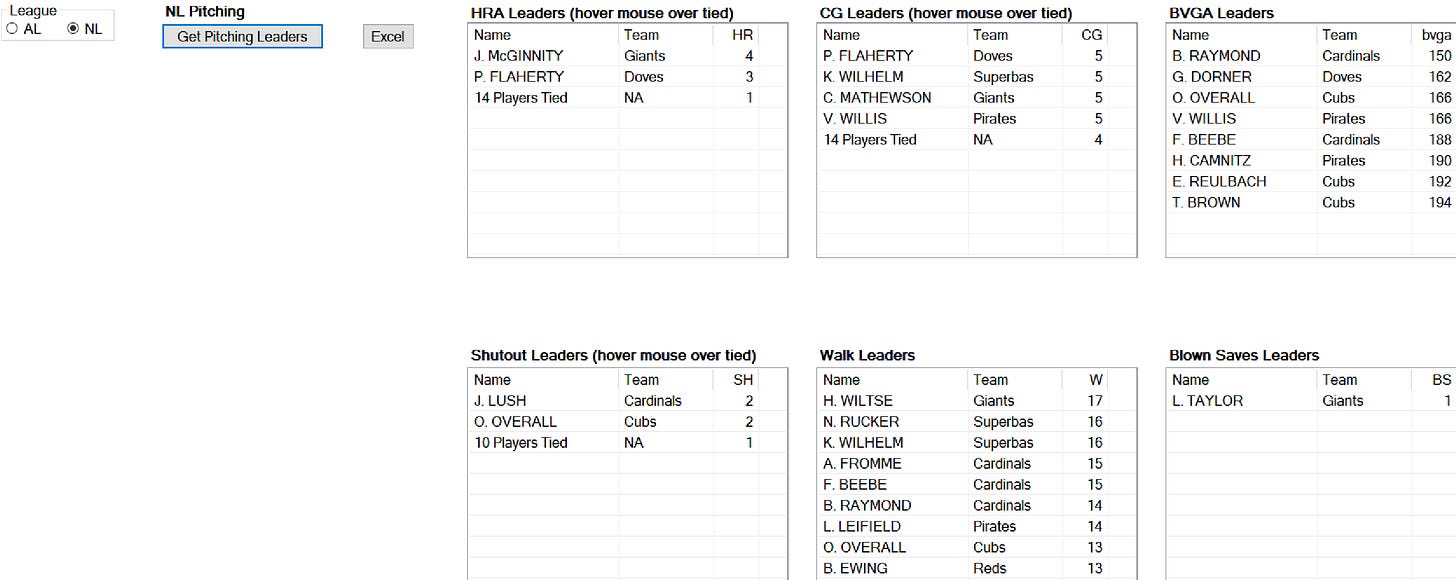
Now comes the pitching:
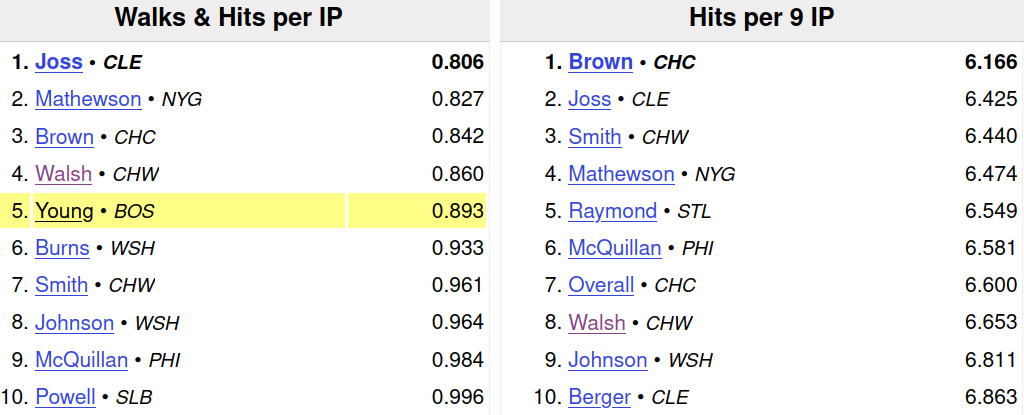
NPIII pitching grades are based on the pitcher’s batting average against, which is a statistic that is surprisingly difficult to find online. In lieu of that, here are the leaders in walks + hits per 9 innings in real life, as well as the leaders in hits allowed per 9 innings:
It’s still early, of course — but it is interesting to now that many of the leaders in real life show up as leaders in Skeetersoft. Guys like Addie Joss, Three Fingered Brown, and Cy Young are having the sort of seasons we expected.
Of course, that will all even out once we have more games under our belt.
American League Stats
Let’s look next at overall team and league statistics. If things are set up and calibrated correctly, these should be close to real life.
First comes the American League.
This is organized by team city — confusing, since it’s not shown. Here’s what real life looks like:
Overall, the American League offensive numbers look good, if a little bit low. .233 / .290 / .296 compares well with the .239 / .294 / .304 in real life. Slugging is a tad off, but the season is young.
In terms of team totals, the St. Louis Browns are underperforming — surprising, since they are currently in second place, and were leading the league for most of the young season.
Let’s look at pitching next:
After eyeballing it, I’d say that I’m probably leaving pitchers in too long. We’ve got more complete games than we probably should.
ERAs across the board are low. The WHIP, however, is almost exactly on.
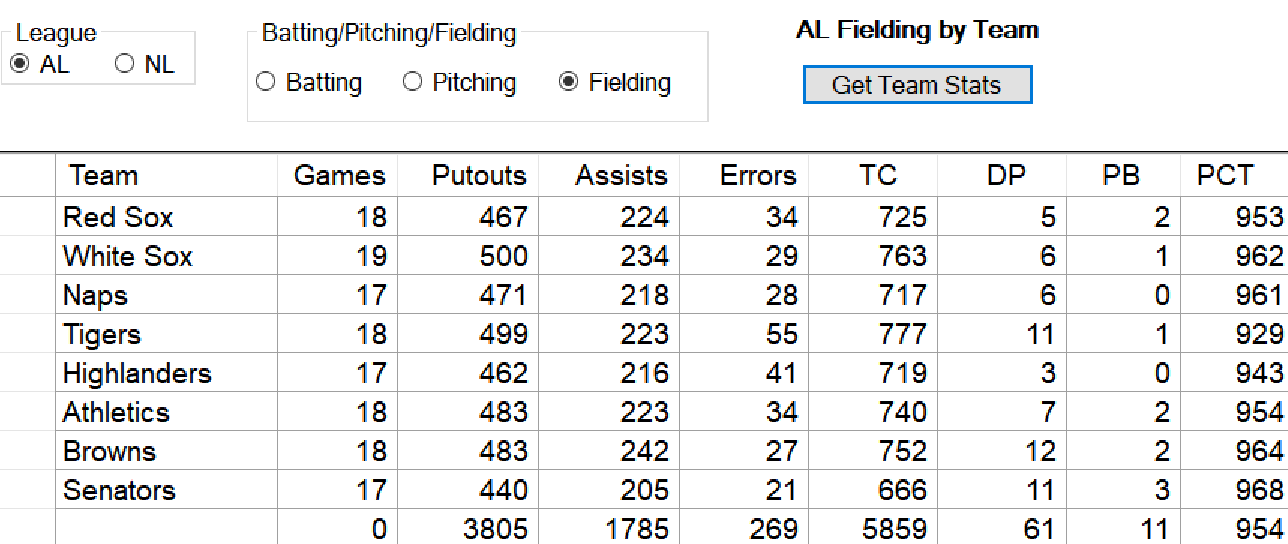
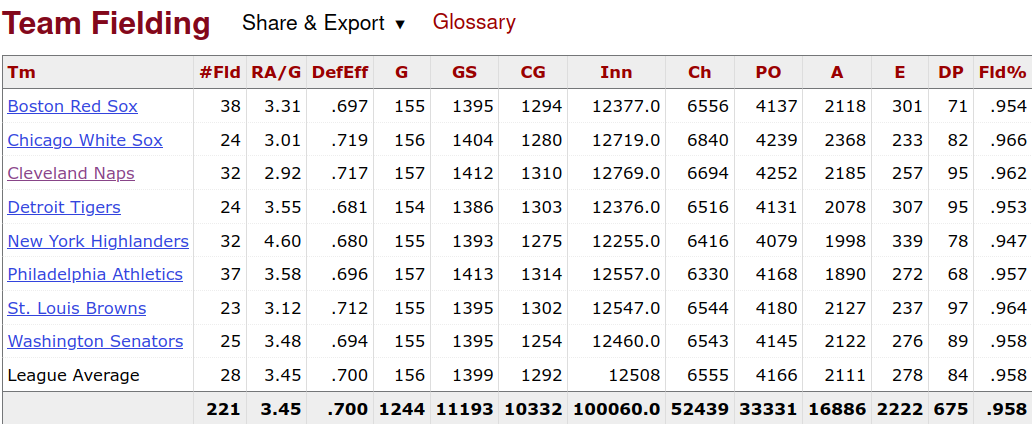
Now comes fielding:
Fielding percentages are almost dead on, which actually is big news. All tabletop baseball games have difficulty with deadball era fielding percentages — all except NPIII, that is.
Double plays seem a little bit low, though it’s not really a cause for alarm at this point.
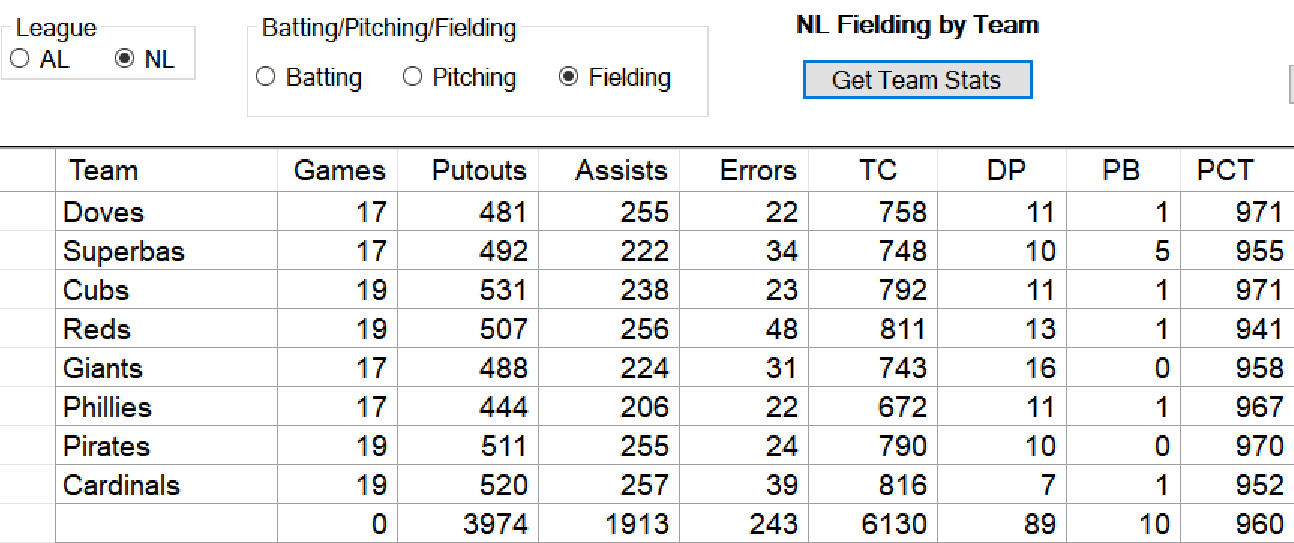
National League Stats
We’ll go a little bit faster through the National League. Hitting comes first:
Again, batting is just a little bit down. It’s awfully close, however, which I consider quite impressive.
ERAs in the National League are actually a little bit high in the replay, which is interesting. Meanwhile, the WHIP is simply dead on, which, again, is really impressive.
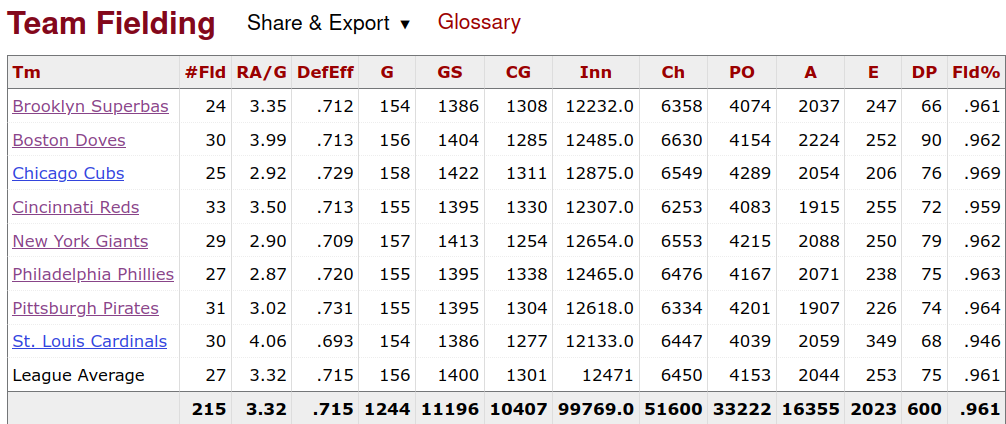
Again, the fielding percentage is dead on. I don’t think I’ve seen another game with fielding results this good, actually. Double plays might be a little bit high, but we’ll see how all of that shakes out in the end.
I think the statistics are good overall. What do you think?

