1908 Stats Update
We’ve completed another week of our 1908 Skeetersoft NPIII replay. Let’s take a look at the stats!
First, of course, comes the standings. You saw these yesterday, of course:
And here is how the teams are doing in one run games:
You can see a pretty clear pattern here, of course. The lousy teams have really bad records in one run games, whereas the teams that are competing generally have pretty good one run records. Of course, the sample size is pretty small.
Batting
Let’s look at the batting leaders, starting with the American League:
Batting averages are coming down, just as we would expect. I suppose Doc Gessler of the Red Sox is the exception with his .394 average.
Harry Niles has somehow managed to hit 5 home runs, which is pretty significant. He managed only 5 in 444 plate appearances in real life. In fact, the real life home run leader of 1908, Tim Jordan, managed only 12 all season. We’ll keep an eye on Niles.
Donlin and Bresnahan are great hitters - that’s all I can say about them.
There’s not too much to say about these secondary stats, since it is still so early in the season.
Pitching
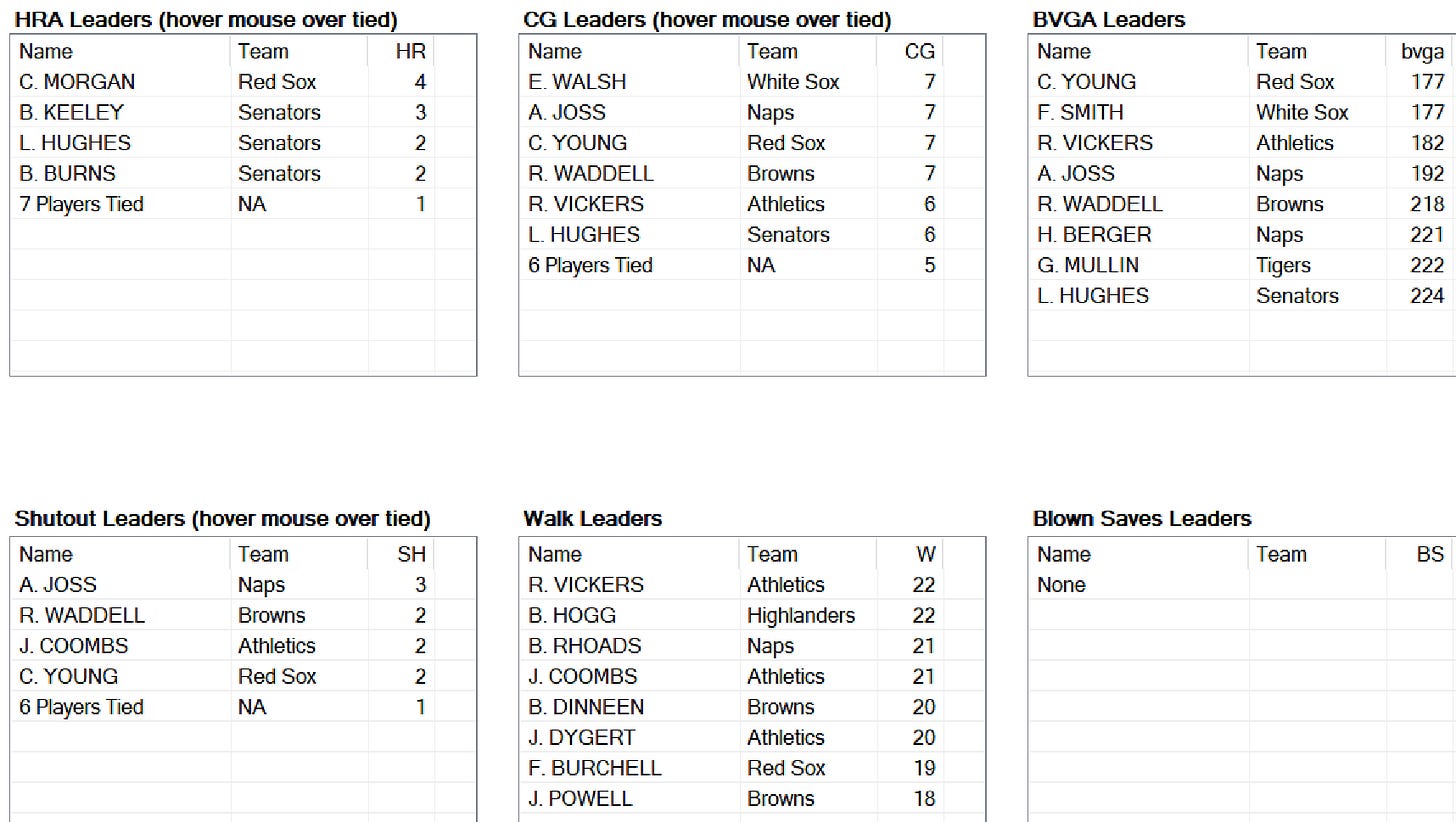
Now we’ll take a look at the pitchers.
The league ERA was low in both leagues in 1908, but I get a feeling that we’re lower than we should be.
I also am probably leaving guys in too long to throw complete games. That’s a bias I’ve got that I have a real hard time getting rid of.
Team Stats
Since we’re only about 24 games into each team’s season, these team statistics will likely be more meaningful than individual statistics at this point.
The American League overall statistics are right on. The 1908 American League in real life hit .239 / .294 / .304; we’re at .238 / .293 / .305 so far. I’m amazed that we’re so close after so few games.
The National League, on the other hand, is still pitching heavy. The real life stats were .239 / .299 / .306, which is actually remarkably close to the American League (you could argue that the two leagues were essentially equal that year). In our replay we’re looking at .228 / .285 / .295. I do think this will increase over time, though.
I also suspect that I might need to start using pitchers in the National League with lower ratings to get those batting statistics higher. I won’t make any dramatic changes at the moment, though. That’s a good way to screw up a replay that is otherwise perfectly fine.
The composite American League real life ERA in 1908 was 2.39. We’re looking at 2.28 in this replay, which is a bit low. However, ERA is a pretty arbitrary stat, one that is honestly pretty overrated. The league WHIP, which I think is a more reliable measure of pitcher effectiveness, stands at 1.15 in the replay, compared to 1.133 in real life - as close as you can get.
The National League ERA is right on: 2.35 in real life and 2.35 in the replay. The WHIP is also close: 1.10 in the replay against 1.141 in real life.
Now we have the fielding statistics, about which I don’t have much to say.
Overall, the stats look very good. We’ll see if it continues!


