April 1908 Statistics
If you’ve ever wondered just how accurate a “basic game” can be, look no further.
I came into this project knowing how close the stats can get using Skeetersoft. And yet I’m still impressed.
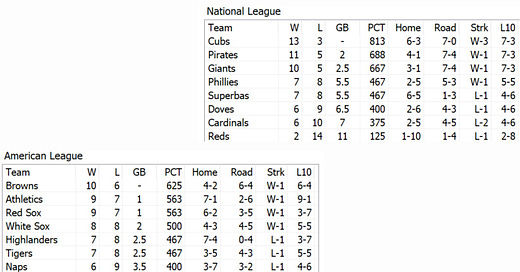
I’ll start this off by showing you the standings, which you’ve already seen:
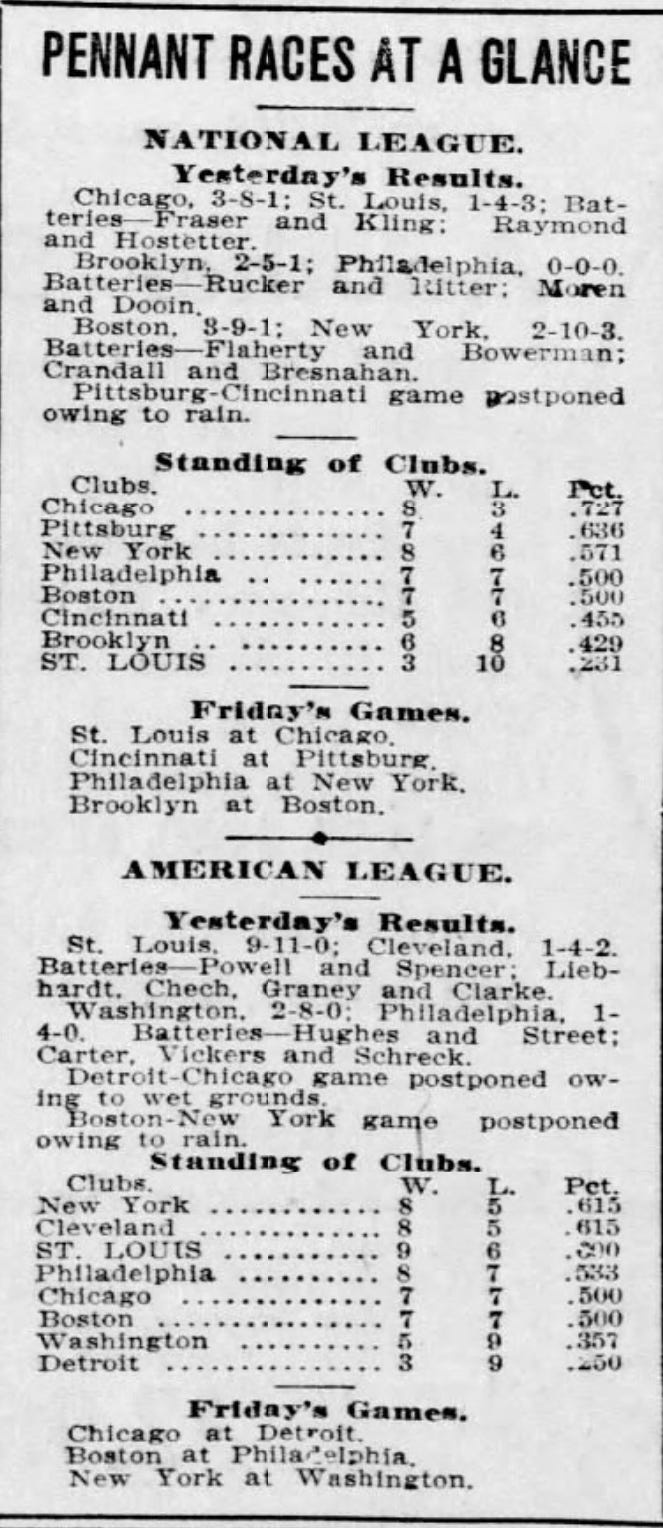
Here’s the official standings on May 1, 1908 in real life, for the sake of comparison:
The real life American League was not quite as close as it’s been in our simulation so far. The Browns were flirting with the top, though, and had more wins than any other team at this point in real life. Note, of course, that I’m playing the as scheduled version of the schedule, not the as played one. This somewhat risque cartoon aptly illustrates just how well the Browns have been:
The National League, meanwhile, looks almost like an exact mirror to what happened in real life — with the most notable exception being the hapless Cincinnati Reds.
Individual Leaders
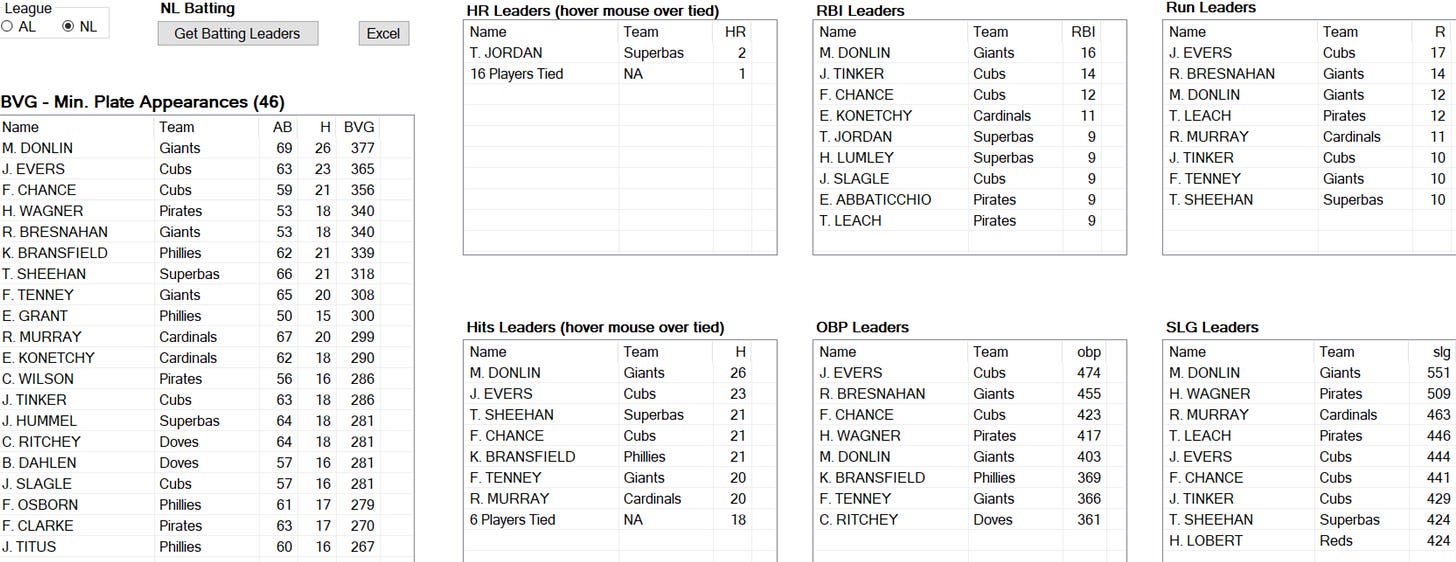
I’m not going to spend a ton of time talking about the individual leaders at this point, since we’re still really early in the season. Take a look for yourself:
It’s simply too early to comment much. Yeah, there are a few pitchers who are pitching over their heads - but we’ve barely had any games played. This will become more interesting as the weeks start to go by.
Team Statistics
This is the part where things get interesting.
At this point, we don’t want to focus too much on how the teams fare against their real life counterparts. Instead, we want to look at those aggregate league statistics.
Here’s the 1908 American League batting statistics. As you can see, the American League is hitting .232 / .291 / .293 in this replay. That’s a little bit under the .239 / .294 / .304 that the league hit in real life — but it’s also really close when you consider that I’m only 10% into the season.
Now, the things I’m really looking out for here are sacrifice hits and stolen bases.
We’ve seen 154 sacrifice hits in 4,614 plate appearances in the replay; in other words, a little over 3.3% of our plate appearances have been bunts. In real life, there were 1,576 sacrifice hits in 45,665 plate appearances — or, in other words, a little over 3.4% of all plate appearances were sacrifices. I think we’re right on.
As far as stolen bases are concerned, we’re looking at 946 hits, 307 walks, and 44 men hit by pitch in the replay, giving us 1297 times runners were on base. This number isn’t exact, since I’m not going to worry about interference and other strange things. We’ve had 165 stolen bases. 12.7% of the time a runner is on base, he steals.
In real life, there were 9702 hits, 2803 walks, and 388 men hit by pitch, for 12,893 times men were on base. There were 1350 stolen bases. 10.5% of the time a runner was on base, he stole a base.
Sacrifices are right on, and steals are a bit hot in the replay.
Here are those American League pitching statistics. The 2.22 ERA is lower than the 2.39 real life ERA. However, the 1.13 WHIP is almost exactly the same as the 1.133 WHIP in real life, which is actually quite impressive.
Now that we’ve got the pattern explained, the National League stats are easier.
.231 / .286 / .300 is a bit low compared to the .239 / .299 / .306 in real life. The American League batting stats were closer.
2.78% of plate appearances in my replay have been sacrifice bunts, compared to 3.64% in real life. It’s close, but it is a little bit low. I think this will improve over time.
Meanwhile, 12.47% of men on base stole successfully in the replay, compared to 10.54% in real life. The “little c” Skeetersoft system is still a little bit hot, but it’s not bad — and I would argue that it’s a lot more realistic than having the replayer try to control base stealing himself.
Here the pitchers are not doing quite as well as they did in real life. The replay ERA is 2.48, compared to 2.35 in real life. The replay WHIP is much closer, however: 1.11, compared to 1.14.
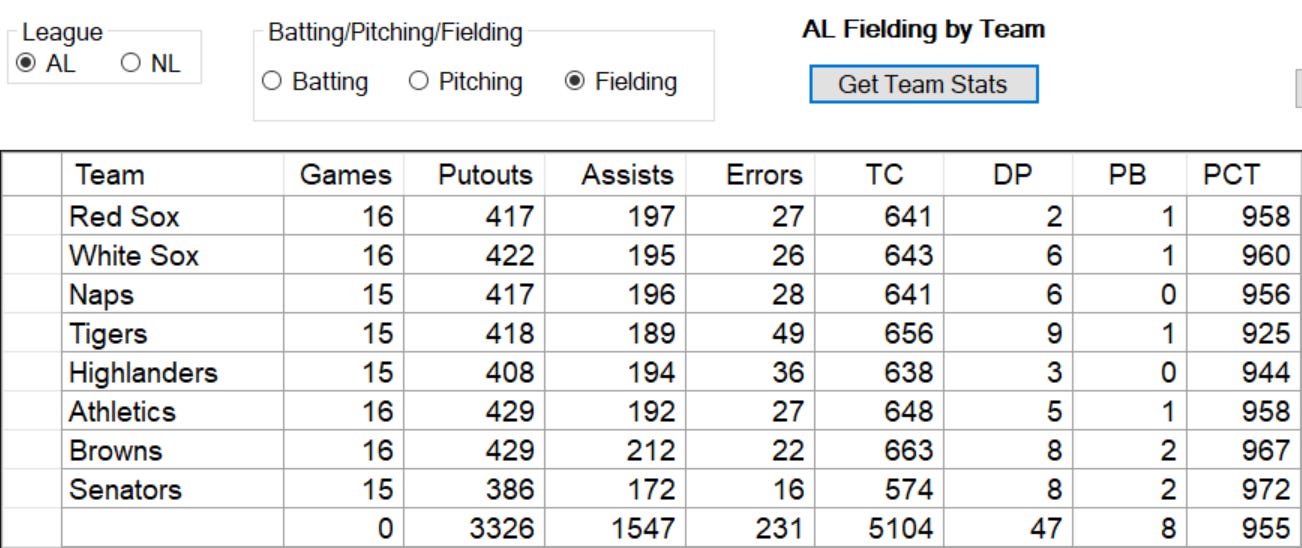
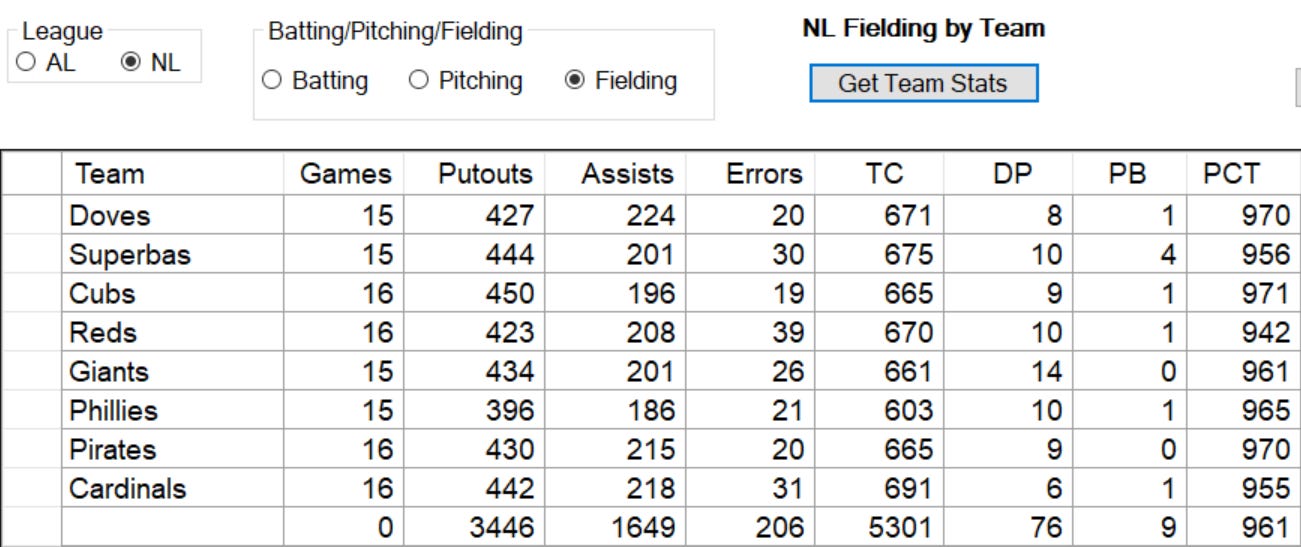
Finally, there is fielding:
In real life, the American League fielding percentage was .958, and the National League was at .961. That’s amazingly close.
We’re too early in the season to say much about double plays; I’ll leave that for later.
Anyway, every time we hit a Sunday in the replay I’ll come back to some of these statistics. We can watch them as they change on a weekly basis. So far, though, I’m pretty impressed.

