April 1949 Statistics
It’s hard to review a baseball simulator in an article or two. There’s really nothing quite like actually playing through each game yourself, appreciating the strengths and weaknesses of the game engine and the user interface as you go.
However, the stats can still tell us a thing or two about what is going on. As such, we’ll take a look at the end of each in-game month to see where we’re at.
We can’t make too many conclusions right now, since it’s only April. However, there are a few things we can point out.
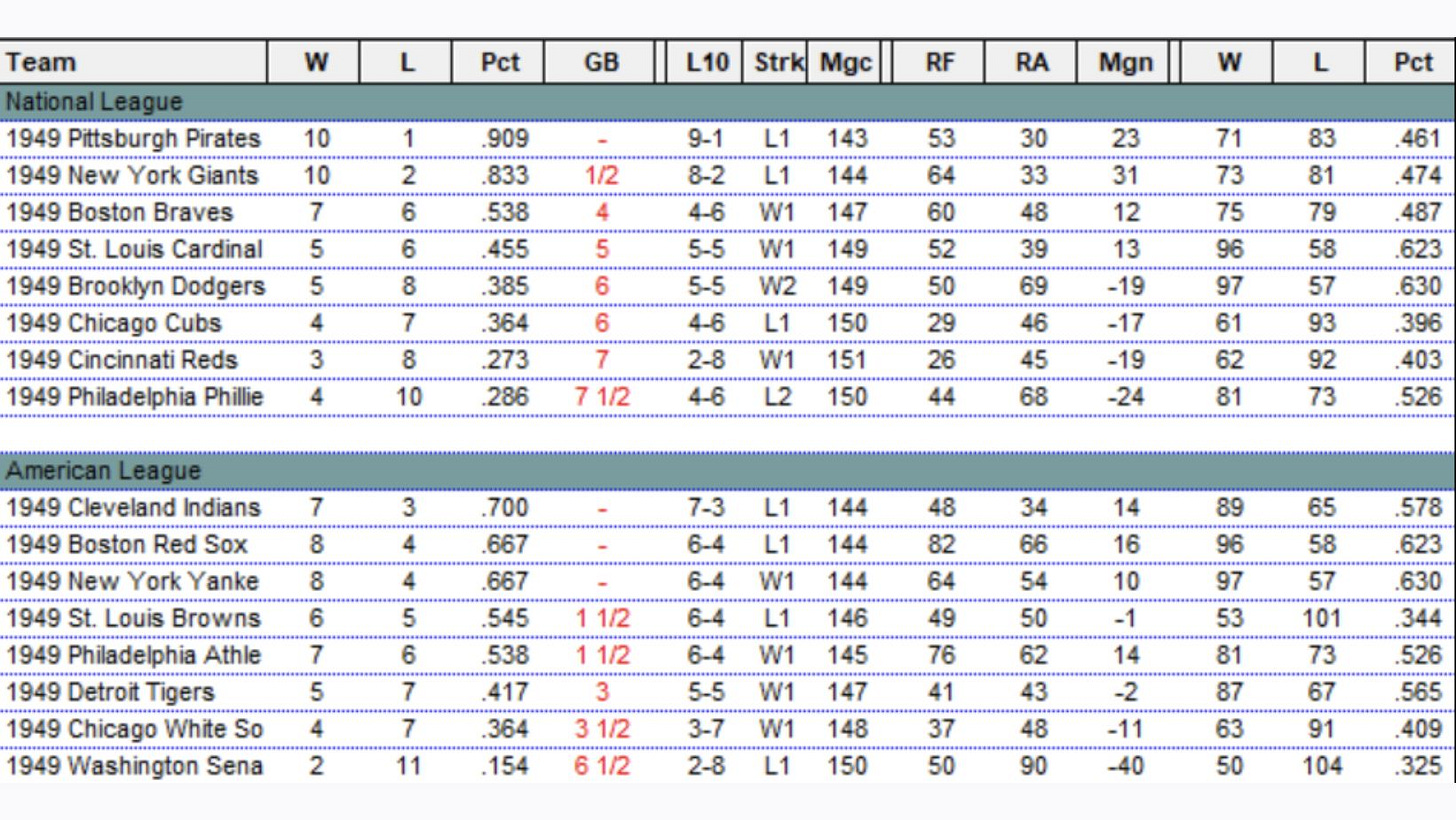
Standings
It’s too early to make any major conclusions here, though you can see from the real life records on the right that a few things are different. The Pirates and Giants weren’t really contenders in real life, for example, and the Cardinals and Dodgers have underperformed greatly.
In the American League, the only real surprise so far is the St. Louis Browns, and they’re still just treading water.
For the sake of comparison, here are the real life standings on the morning of May 1, 1949:
The real-life National League was much tighter than it’s been in this replay.
Individual Leaders
I’ll be honest with you. I’ve got little time or patience for extremely complicated sabermetrics.
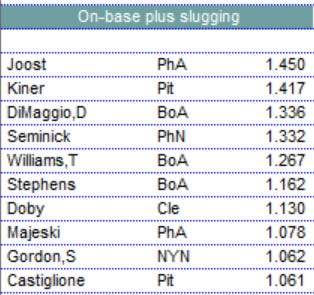
We’ll keep these reports relatively simple for the time being. Here are the individual leaders so far:
Offense
Dom DiMaggio has been absolutely incredible, hitting .500 in the month of April.
Interesting to see Eddie Joost inch past Ralph Kiner in the early home run race.
My guess is that these steal numbers are probably a little bit high. I’m probably at fault for stealing too frequently.
Pitching
Here you can see why the Pirates have been so good so far. They’ve had excellent starting pitching, headlined by Bill Werle.
It’s really too early to show won-loss records, but here you go anyway.
Similarly, it’s too early to show these three stats against pitchers. This will look more realistic as we move along.
One of Brooklyn’s biggest problems has been Preacher Roe giving up home runs left and right.
Team and League Stats
Finally, let’s take a quick look at the team and league stats so far.
The Athletics have been hitting surprisingly well, and the Dodgers have looked poor. Compare this to the real life totals:
Notice, by the way, how close the league average is to real life despite the small sample size. The replay comes in at .260 / .339 / .382; in real life, it was .263 / .344 / .384. That gives you an idea of how powerful the game engine is.
Here are the pitching stats:
And here are the real life totals:
This is where we’re seeing a difference. The Diamond Mind average ERA is 3.79; in real life it was 4.12. If this is going to even out, we should expect to see a hot summer with a lot of hitting.
Now, it’s possible that my philosophy to always “play to win” has prevented me from using poor pitching as often as I should. I think this is more likely a sample size issue, though.
As far as walks are concerned, we’re looking at 789 in 95 games (remember that it takes two teams to play a single game), or 4.15 per game. As I reported earlier, the combined American and National League totals of walks per game in 1949 was right around 4.2, which means that Diamond Mind is almost exactly right. We’re on a good pace.
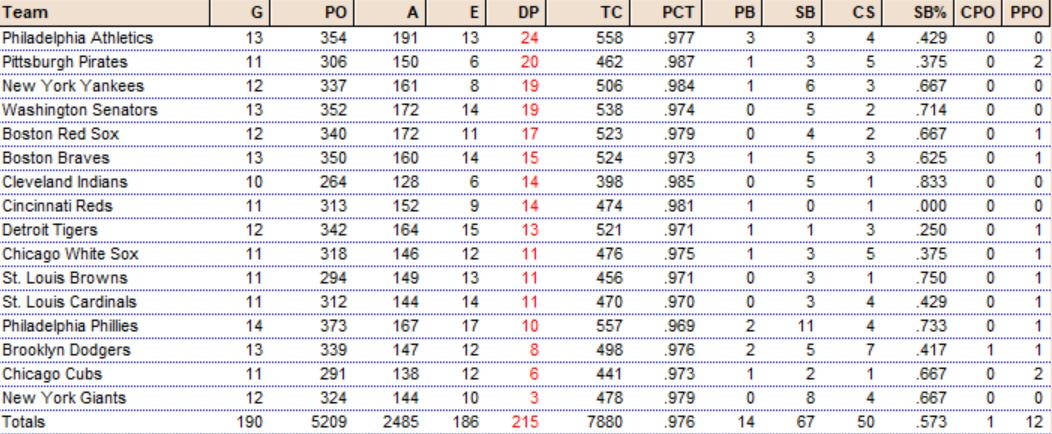
Finally, let’s look at the fielding:
I sorted this by double plays, of course. You’ll see why in a second.
Now, I suspect that this is where the real problem lies.
In real life, there were 2700 double plays in 1240 games (remember that it takes two teams to play a game), or about 2.18 double plays per game.
In contrast, in the replay, there have been 215 double plays in 95 games, or about 2.26 double plays per game.
That might not look like a huge discrepancy, but the problem becomes far more obvious when we look closer at the better fielding teams.
The Philadelphia Athletics have turned 24 double plays in 13 games. You don’t even have to do the math to see that they are on an insane pace to obliterate the mark they set that year in real life. They’re averaging 1.85 double plays a game, against 1.41 double plays per game in real life.
The Pirates have turned 20 replay double plays in 11 games, for an average of 1.82 per game. The Yankees have turned 19 in 12, for a 1.58 average. Even the Senators are up there, with 19 in 13 for a 1.46 average — still on pace to beat what the Athletics did in real life.
This is a huge problem. There are too many double plays, which I believe is stifling the offense and leading to low ERAs.
We know that the hitting averages are right. The walk totals are also right. Teams are getting enough baserunners. The problem is that too many baserunners are being erased by double plays, which is keeping runs per game down.
I suspect that this has something to do with Diamond Mind’s fielding engine. I also think that every single modern computer baseball simulator likely has similar issues with 1949’s unusually high double play totals.
I’d love to know what your thoughts are on this subject.


