Does Skeetersoft Handle 1908 Realistically?
It’s hard to write about statistics.
I don’t like doing it. I find myself trying to steer myself away from the task.
The reason is obvious. Numbers seem so sterile, so empty. They don’t tell a story for you.
Writers want to tell a story. Writers want to share a narrative — something that might enlighten, inspire, shock, or amuse the reader. And the numbers seem such a bore.
But, at the same time, I know that it’s important to talk about the stats in a replay. And that’s my quandary.
Most of my statistical reviews look something like this post:
1908 Statistics Update
1908 Statistics Update We’ve reached the end of another week, which means it’s time to see how the stats are doing. First, the standings:
I’m not proud of it. I tend to rush through it, sticking a bunch of screenshots up and hoping that will be enough.
Let’s see if we can do something else today.
The Little Game That Could
I was on Delphi Forums a few days ago, posting what little I know about the history of National Pastime on a Strat-O-Matic board.
I can’t remember the theme of the thread. I’m sure somebody out there has a link and can remind me. It was something about how the APBA pitching system compares to the system in Strat-O-Matic.
I’ve always felt that the basic game systems from both companies were similar and somewhat comparable, with strengths and weaknesses. Strat’s advanced game, however, has always been superior to the APBA master game in my mind — and the super advanced game feels even better.
We can quibble over specifics — the 50/50 system, whether the lefty/righty system creates imbalances, the difficulty Strat has with extreme performers, and so on and so forth. But there’s no doubt in my mind that a system in which the pitcher can impact the outcome of every play is superior to a system in which the pitcher can only impact the outcome of base hits — and, really, only singles at that.
You’d think that a game in the APBA tradition would have tons of problems with a season like 1908, right?
That’s why NPIII really impresses me.
I’m going to dispense with the individual stats this time around. We’ve only played through May 24. If youre dying to know, Honus Wagner is hitting .388 for a team that’s losing, Mike Donlin is hitting .358 for a team that looks like one of the best ever, Ty Cobb is hitting .329 on a sinking ship, and there are over 2 dozen pitchers with ERAs under 2.
It’s the aggregate stats that are more interesting.
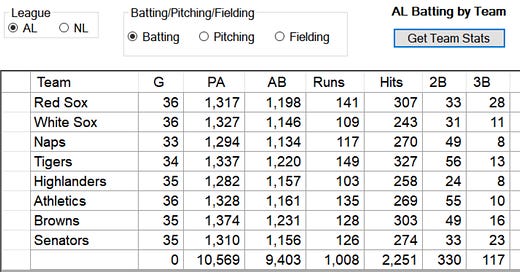
Check out the batting tallies in the American League, for example:
The .239 / .295 / .308 marks are quite good. In real life, the totals were .239 / .294 / .304.
The pitching is also right on. The 2.44 ERA is a little bit higher than the 2.39 ERA, but it’s certainly close.
If my math is right, the American League pitchers are allowing 3.6 runs per 9 innings, compared to 3.44 in real life. Again, this is quite close for a “basic” game.
The National League is still a bit depressed. .230 / .284 / .296 is clearly lower than the .239 / .299 / .306 of real life. It’s still close, however.
And, as was the case last time, the pitchers are a bit too dominant in the National League. The 2.26 ERA is crazy low; the real life ERA was 2.35. There’s also a strange error in the won/loss records, which I’m probably going to have to dig into at some point in time. It strikes me as odd, since these statistics are automatically compiled — this can’t be a user error.
Overall, though, it’s not too bad.
I think we’ll hold off from doing one of these major statistic checks for a little while, though, since this one wasn’t substantially different from the last.


