Historic On Base Situations
Ever wonder what percentage of plate appearances come with the bases empty? Or with a runner on second?
Have you ever wonder if this number has changed over time?
If you’re an average baseball fan, you’ve probably never thought about any of this. You probably figure that players play the same way regardless of the on base situation.
And, honestly, I don’t think you’re wrong. I haven’t done the in-depth statistical work to test it out. I have looked at the stats, though, and I honestly don’t think that players play much differently if somebody is on base.
However, if you know your baseball simulation history, you know why this stuff is important.
After all, this is what Clifford Van Beek designed his game around.
Why?
You see, National Pastime was a different sort of game.
Many of you might be used to games like Strat-O-Matic, Pursue the Pennant, and numerous other games of its kind. That type of game has predictable results no matter what the on base situation is.
Here — I’ll show you what I mean:

Let’s say you’re playing the old 1975 Strat-O-Matic season, and you’ve got Luis Tiant pitching and Joe Morgan hitting. If you get a 3 on the white die and the two other dice add up to 4, Morgan hits a home run. It doesn’t matter if the bases are loaded or if the bases are empty: it’s a home run either way.
Similarly, if that white die is a 4 and the two other dice add up to 7, Tiant strikes Morgan out. It doesn’t matter what the situation is at all.
National Pastime (and, later, APBA, as well as its numerous derivatives) is different.
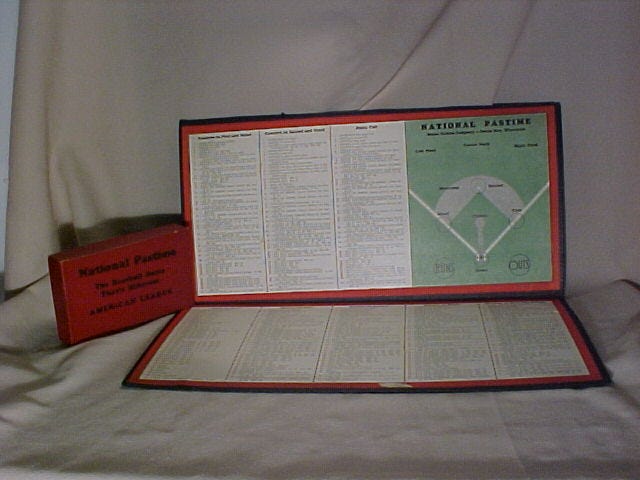
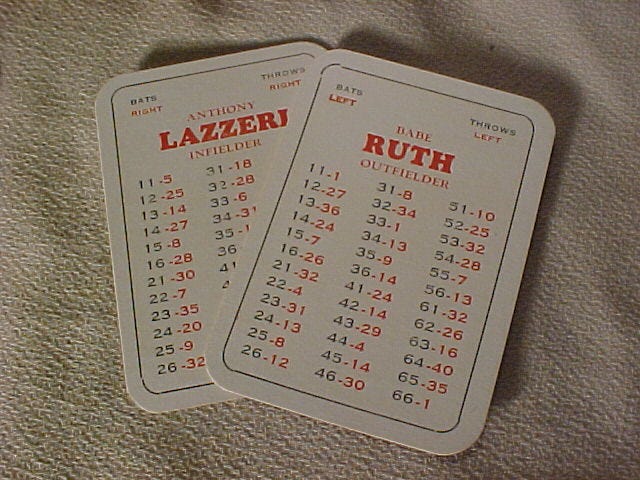
This picture isn’t great, but it will do. If Babe Ruth is hitting and he rolls a 44 for a 4 result, the end result depends on the boards. It’s a double with the bases empty, but a triple with a runner on first. Ruth hits a double that scores two if the bases are loaded, but hits a home run with runners on second a third.
Now, if you sit down and think about this for a while, you’ll realize that Clifford Van Beek needed to figure out what the breakdown was between those on base situations. He needed to know about how often the bases are empty, about how often there are runners on at first and second, and so on.
Clifford needed to know this for two reasons:
He needed to know how to construct the playing boards.
He needed to know how to card the players he created.
This situational breakdown is the heart of the game. Because the play results vary depending on the on-base situation, you can’t even start to analyze the game without starting at this step.
Historical On Base Frequencies
Now, I don’t know what numbers Clifford Van Beek actually used. I do think we might be able to guess if we fiddle with the boards enough.
However, I do know what the historical numbers are.
And, honestly, they’re quite remarkable.
Historically, the frequencies of each on base situation have remained consistent. They’ve been more or less the same regardless of the era, regardless of the batting average, and regardless of the numbers of players.
This is one of those rare things that you discover when you spend a bunch of time looking at baseball statistics. Every era looks more or less the same in this case.
I went through the “League Splits” page on Baseball Reference to gather this data. I looked at both plate appearances and at-bats, reasoning that Van Beek probably used at bats if he had this data at all.
Baseball Reference’s data goes back to 1914. It appears that this comes from Retrosheet data. Naturally, some seasons are not complete. In fact, some of the older seasons include this data for only about 40% of the plate appearances that we know took place that year.
And the crazy thing is that it doesn’t really matter. The data is consistent anyway.
Here are the plate appearance averages:
In other words, in the last 118 years of baseball, about 54% of all plate apperances were with the bases empty. This ranges from an all-time low of 49.11% (the 1936 American League) to an all-time high of 57.97% (the 1968 American League).
The standard deviation of those ratios is quite small. Both of those seasons were outliers, clearly. But the really interesting aspect here is just how consistent the number holds despite the varoius eras.
In 1914, for example, 55.17% of all American League plate appearances we know about were with the bases empty. You might think the sample is too small to work with, but I’d disagree. We’ve got this data for 53.12% of all known plate appearances in 1914 — enough to convince me that the stuff we don’t have probably wouldn’t change our findings.
In 1991, 55.17% of all American League plate apperances were with the bases empty.
2022 was a little bit high, but not much. 56.83% of all plate appearances were with the bases empty, a total that is just a hair above that 1.98% standard deviation.
At bats tell a similar story:
The numbers aren’t exactly the same. However, if you’re creating a baseball game that uses two dice and these numbers to generate outcomes, the ratios are clear and easy to work with.
Basically, for the entirity of baseball history, the breakdown looks something like this:
Bases empty — 55%
Runner on first — 19%
Runner on second — 8%
Runner on third — 3%
Runners on first and second — 7%
Runners on first and third — 3%
Runners on second and third — 2%
Bases loaded — 2%
That adds up to 99%; you could probably make the runner on first calculation 20% and call it good.
Now, I don’t know what numbers Clifford Van Beek used. I do know that the APBA community has traditionally used somewhat similar numbers, with a bit of deviation.
I also think we might be able to play around with the boards and see if we can’t figure out how often each situation should come up in National Pastime.
I’m not sure if I can get it right, but I’ll give it a try. Why not?
Want to check my work? Paying subscribers can access the spreadsheets in the Member’s Area!


