


In Defense of Situational Charts
The statistical argument for an old practice

In Defense of Situational Charts
If you’re a fan of tabletop sports simulators, you know that the charts of old are on the way out.
And good riddance. Most of us don’t have the table space for monstrosities like this:
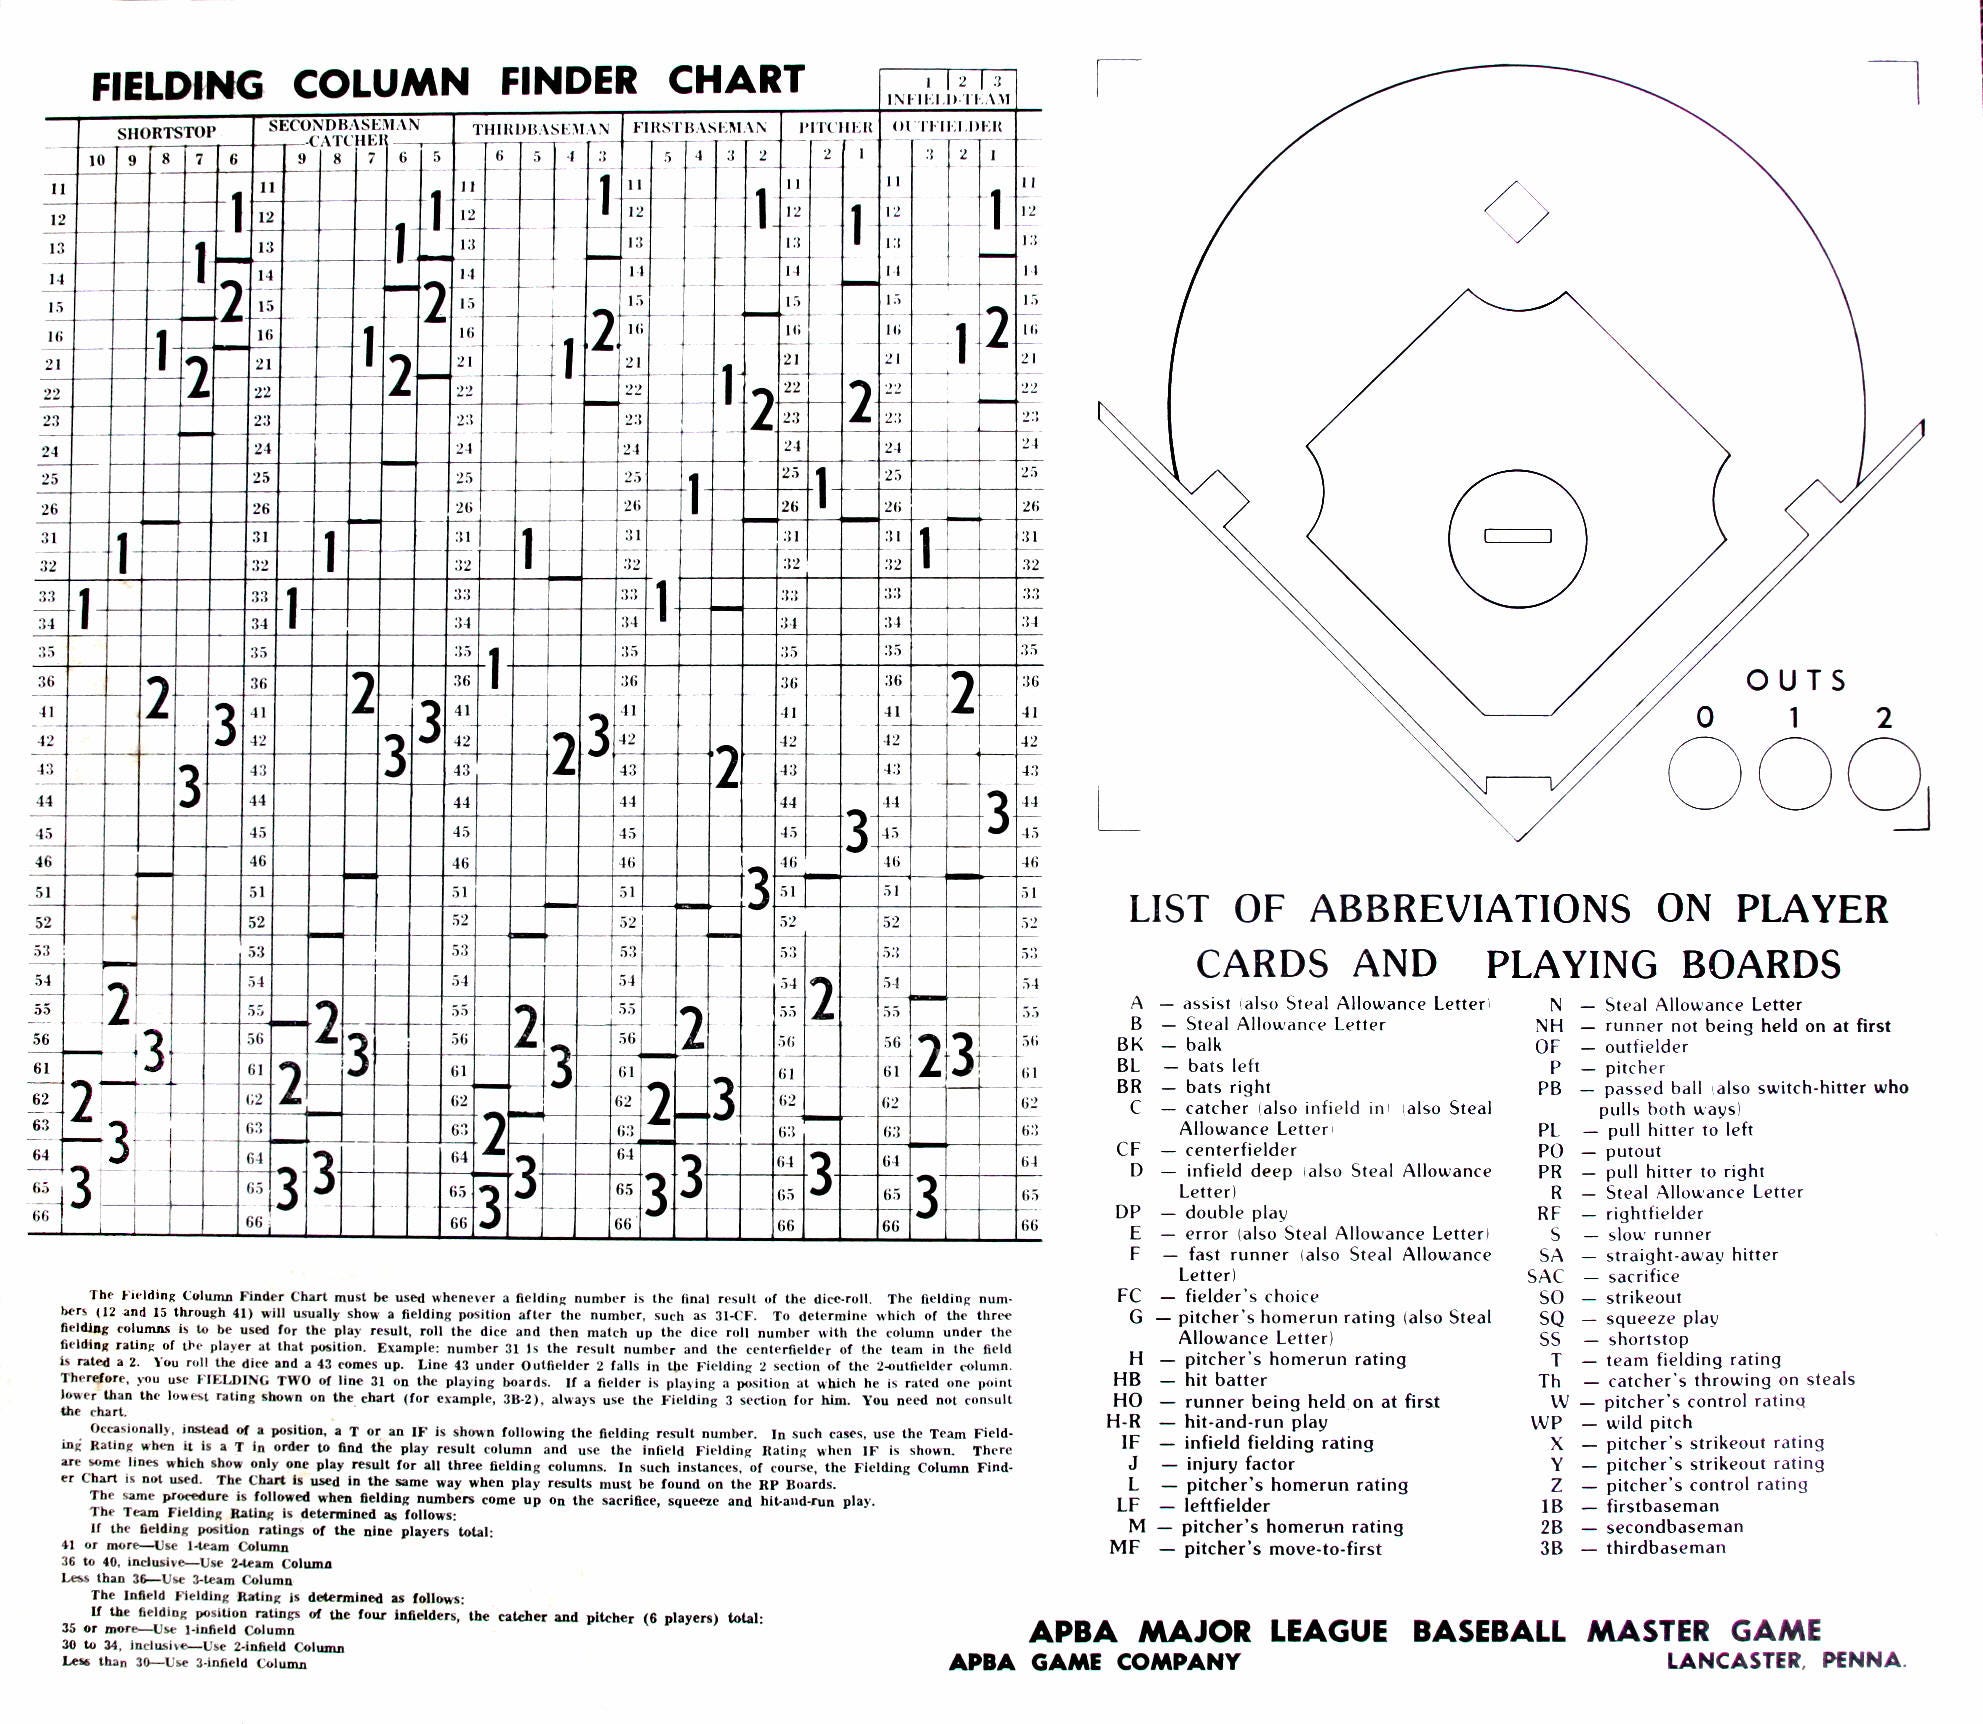
After seeing the system the old Replay game used to determine which fielder got the ball, I never want to go back to this “Fielding Column Finder Chart” again. It’s awful.
Anyway — one issue with modern games is that the on base and out situations have absolutely nothing to do with the play results. And, well, that just isn’t very realistic.
There are two ways of looking at this. The first is the most obvious way: looking at the Run Expectancy Matrix probabilities that Fangraphs talks about.
Basically, different base situations and different numbers of outs lead to different expected numbers of runs scoring:

You can, naturally, use these expected run totals to evaluate player performance, which is exactly what Fangraphs does.
However, you can also use these values and concepts to modify a game engine for more realistic results. Theoretically, that is.
Hitters will hit differently with nobody out than they will with two men out. And, similarly, pitchers have different strategies for different situations.
But the easiest way to see that is through the second method: looking at historical splits.
Let’s take a look at historical splits per base situation for four different seasons: 1919, 1949, 1979, and 2009. That gives us a good mix of data from different eras.
Now, for the sake of simplicity I’ll remove the number of outs. Remember, though, that the number of outs actually does impact results. I’ll let you jump over to Baseball Reference to solve that yourself if you feel up to it.
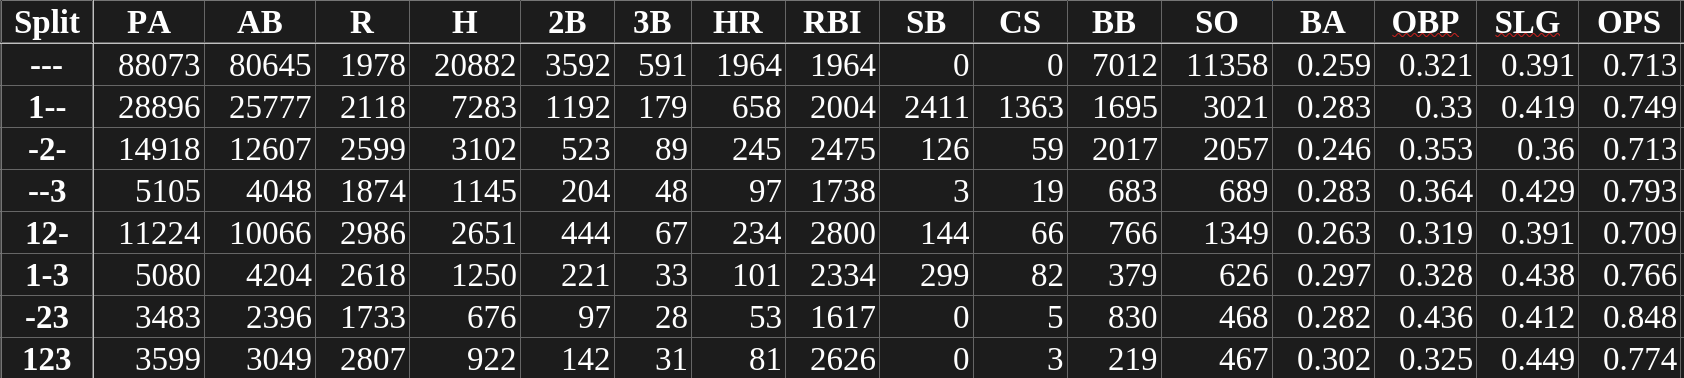
First is 1919:

Now, there wasn’t much offense in 1919. Hoewver, notice how the amount of offense changes based on the base situation. Having a runner on third base, runners on first and third, and runners on second and third resulted in a pretty dramatic change to the average OPS.
I’ve also calculated percentages of certain results per plate appearance, to make them easier to compare:
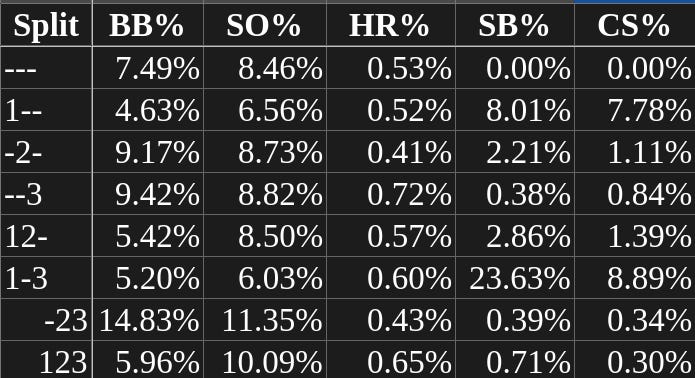
It was a lot more likely for a batter to be walked with runners on second and third than with the bases loaded. Similarly, defenses seem to have been far more willing to attempt to steal bases with runners on first and third than in any other situation.
It seems that having first base open significantly changed the way that pitchers approached their task.
Okay — let’s look at 1949.

Our OPS totals have gone up across the board. However, the interesting thing here is that hitters tended to hit a lot better with runners on second and third than in any other situation. Hitters were worst with nobody on base.
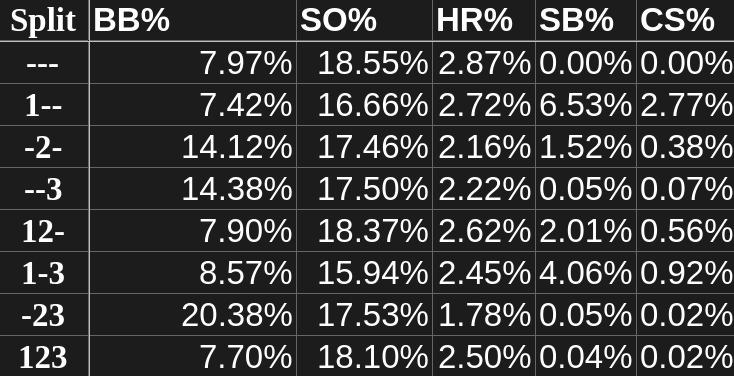
And now the percentages:

Once again, that temptation to steal second with a runner on third was still present. The fascinating thing here, though, is that it really wasn’t likely for pitchers to walk batters with first base occupied. Remember, of course, that 1949 was the year of the walk: there were more bases on balls per plate appearance in 1949 than in any other season in baseball history.
Now on to 1979:
Once again, we see that players tended to hit better with a runner on third base. In particular, they hit well with runners on second and third, and with just a runner on third.
This is consistent with the pattern we saw in 1919 and 1949.

And, once again, walks were far more likely with first base open than with first base occupied. This indicates to me that there was likely a change in approach by the pitcher.
Interestingly, stolen bases attempts almost exclusively came with either a runner on first or runners on first and third. Straight steals of third and home were extremely rare, even in the crazy artificial turf era. And very few even dared steal bases with runners on second and third, or with the bases loaded.
Notice as well that the strikeout ratios have increased across the board over time.
And, finally, 2009:

The change in OPS here is pretty interesting. Hitters actually did better with runners on first and third and runners on third than with runners on second and third. Remember, of course, that OPS includes walks (as part of the on base percentage component), so this isn’t necessarily due to pitchers just walking guys in those situations.
And here’s where the march towards the boring baseball of unending strikeouts is most apparent.
As usual, walks were higher with first base unoccupied. There were a few more steals of home, though, which kind of surprised me.
Anyway, there you have it. The next time you have a pitcher walk a man with the bases loaded, keep these charts in mind. Perhaps games should have situation dependent results after all.
I do like how Replay has an element of this. But also, if you corrected your real-life BB% by base situation stats so they do NOT include IBB, I’ll bet the numbers would not be nearly so dramatic. Unless I missed something, I think the stats you show include BB’s + IBB’s.
And, once again, Replay nails this. The Column 5 (walk) results vary by base situation and the impact of the infield positioning in Column 4 will also produce variance in batting averages by base situation. But it's not too extreme (e.g., pitchers with good control *never* walking anyone if first base is occupied). (PS - I am greatly enjoying your posts and videos.)