


Month By Month Batting Stats
Bill James and sample size

Month By Month Batting Stats
In this installment of our slow and methodical look back through the history of sabermetrics, we come across this description of a section of the 1980 Bill James Baseball Abstract from Richard Lederer:
Now, looking at month-by-month batting averages is interesting for a number of reasons. You can see young players learn how to hit major league pitching, for example, or see what happens when pitchers learn that you can’t feed Robin Yount a diet of fastballs. You can also see (in theory) how hitting improves as temperatures increase.
Thankfully, Baseball Reference provides us all of these statistics — as well as game by game statistics if we really want to get into the nitty gritty.
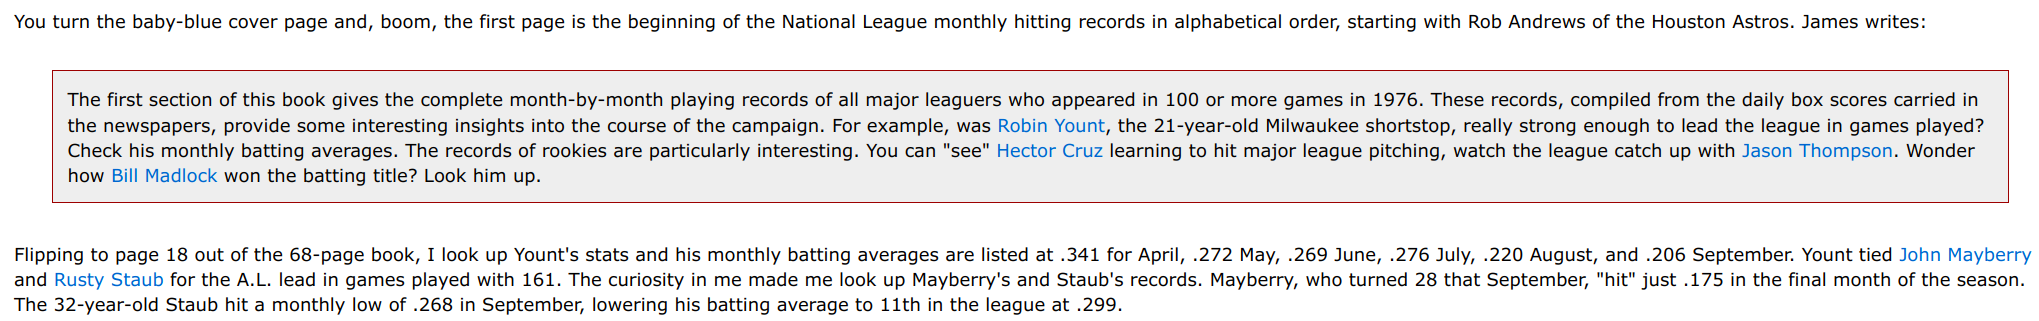
Let’s look at Robin Yount’s 1976 season as a starting point:

Just as Bill said, Yount’s explosive start to the season cooled down considerably as time went on.
Of course, a single season doesn’t necessarily mean all that much. If James had compiled those statistics for 1975, for example, he would have noticed that the pattern simply doesn’t exist:

This is one of those places where what we think is a significant pattern actually isn’t. Check out Yount’s career batting statistics by month:

Maybe Robin had a hard time hitting in August for whatever reason. Still, this gives you a good example of how small sample sizes (i.e. only 100 plate appearances or so) can cause you to see patterns that don’t really exist.
1976 was Hector Cruz’ first full time major league season, which is probably why Bill picked on him. And, like James said, you can sort of see him learn how to hit major league pitching:

Actually, when I look at Cruz, I wonder how in the world he was given a full time job with the Cardinals in 1976. He had two cups of coffee before that, and fared even worse:

Perhaps he was a really good defensive third baseman. He managed to finish 3rd in the 1976 Rookie of the Year voting, despite hitting .228 / .286 / .338 — the sort of average you’d expect from a shortstop, not a third baseman.
Anyway, when you look at Cruz’ career offensive stats by month, the pattern disappears again:

Cruz looks like a poor hitter regardless of the month. James was wrong: Hector never learned how to hit big league pitching.
In 1976, the National League “caught up” to rookie Jason Thompson pretty quickly:

I mean — hitting major league pitching is never easy, but you’ve got a much better chance of putting up good stats in 21 plate appearances than in 113. Jason had 7 hits, mostly singles, and looked like a great hitter as a result.
Take a look at his career, and the pattern disappears once again:
Finally, James mentions Bill Madlock, so we’ll look at his 1976 season as well:

Madlock got hot early, slid a little bit in June (though he sure looks better than the other hitters we’ve looked at), and really caught fire in the dog days.
And, when you look at his career, it seems that he really preferred hitting in the heat:
So does this mean anything? What historical patterns should we compare these individual stats with?
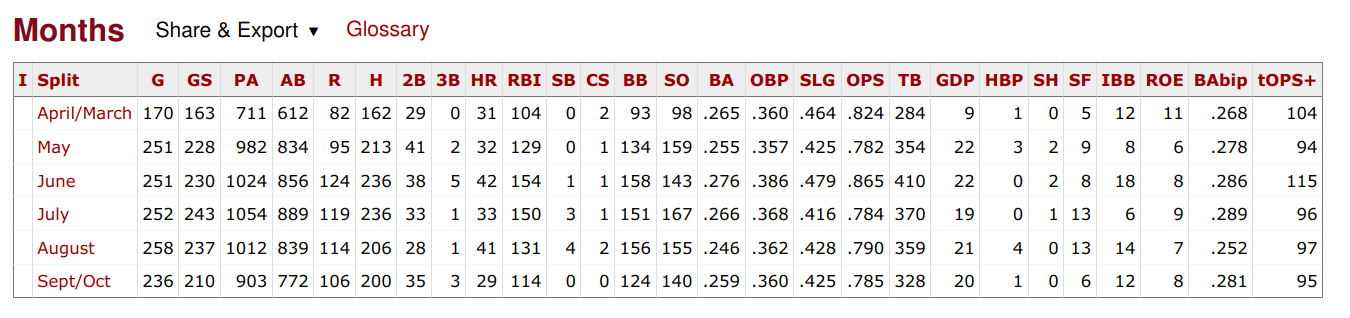
I used Stathead to run every season from 1901 to 2024 by month:

Unfortunately, I couldn’t figure out how to make the results start in April and end in October. At any rate, you can see here that batting statistics generally remain constant throughout the year when you look at the full population (or however many individual events are contained in the Stathead database).
In other words — there is not any indication that offense warms up in July and August.
Let me know what you think.