More National Pastime Play Result Numbers
Yeah, there’s still more to say on this topic. Actually, there’s a lot more to say.
Last time we looked at a basic breakdown of play result numbers in National Pastime. However, we can do better than that. Let’s look at some more specific breakdowns to get a better idea of how these numbers were distributed.
Postition
First, we can look at the breakdown by position.
We’re talking here about the position listed on the card, which is one of four things:
Catcher
Infielder
Outfielder
Pitcher
We do know that Clifford Van Beek kept track of real life lineups to create an accurate real life lineup sheet, one that included actual positions. Those do not appear on the cards themselves, however. We’ll save an examination of that for another time.
This is how the play result numbers are broken out by the positions listed on the cards:
The %All column tells us how frequently that particular result came in comparison to all other results for that specific position. In other words, when we note that result 40 appeared 38 times on catcher cards, the 3.02% means that 3.02% of all play result numbers for catchers were “40.”
The %PRN column tells us what percentage of all instances of that play result number comes from players who play this position. Here we see that infielders account for 19 of the 19 “41” play result numbers: this is why the %PRN column shows 100%.
Now, anything here that is 50% or higher is going to be significant, though we can only guess as to why. For example, as I alluded to earlier, 100% of all “23” results come on pitcher cards. What’s more, every single pitchers card has both a 23 and a 22, since there are exactly 80 pitchers in the game (5 per team, 16 teams total).
The pitcher cards contain no additional error numbers, which I’m guessing is something you didn’t now off the top of your head. Pitchers also have no “36” results, no “41” results (those belong only to a handful of infielders), no “10” or “11” results (I guess pitchers don’t steal bases?), and no “1” or “2” results.
APBA veterans will also be mystified by the fact that play result number “9” only shows up twice on pitcher cards.
A few other things of note:
About 87% of “21” results come on infielder cards.
Around 71% of “17” results come on outfielder cards.
A whopping 90% of “19” results come on outfielder cards.
Pitchers account for over 50% of the “13” results in the game. This will probably be important when we start looking closer at the distribution of play result numbers “13” and “14.”
Batting Order Position
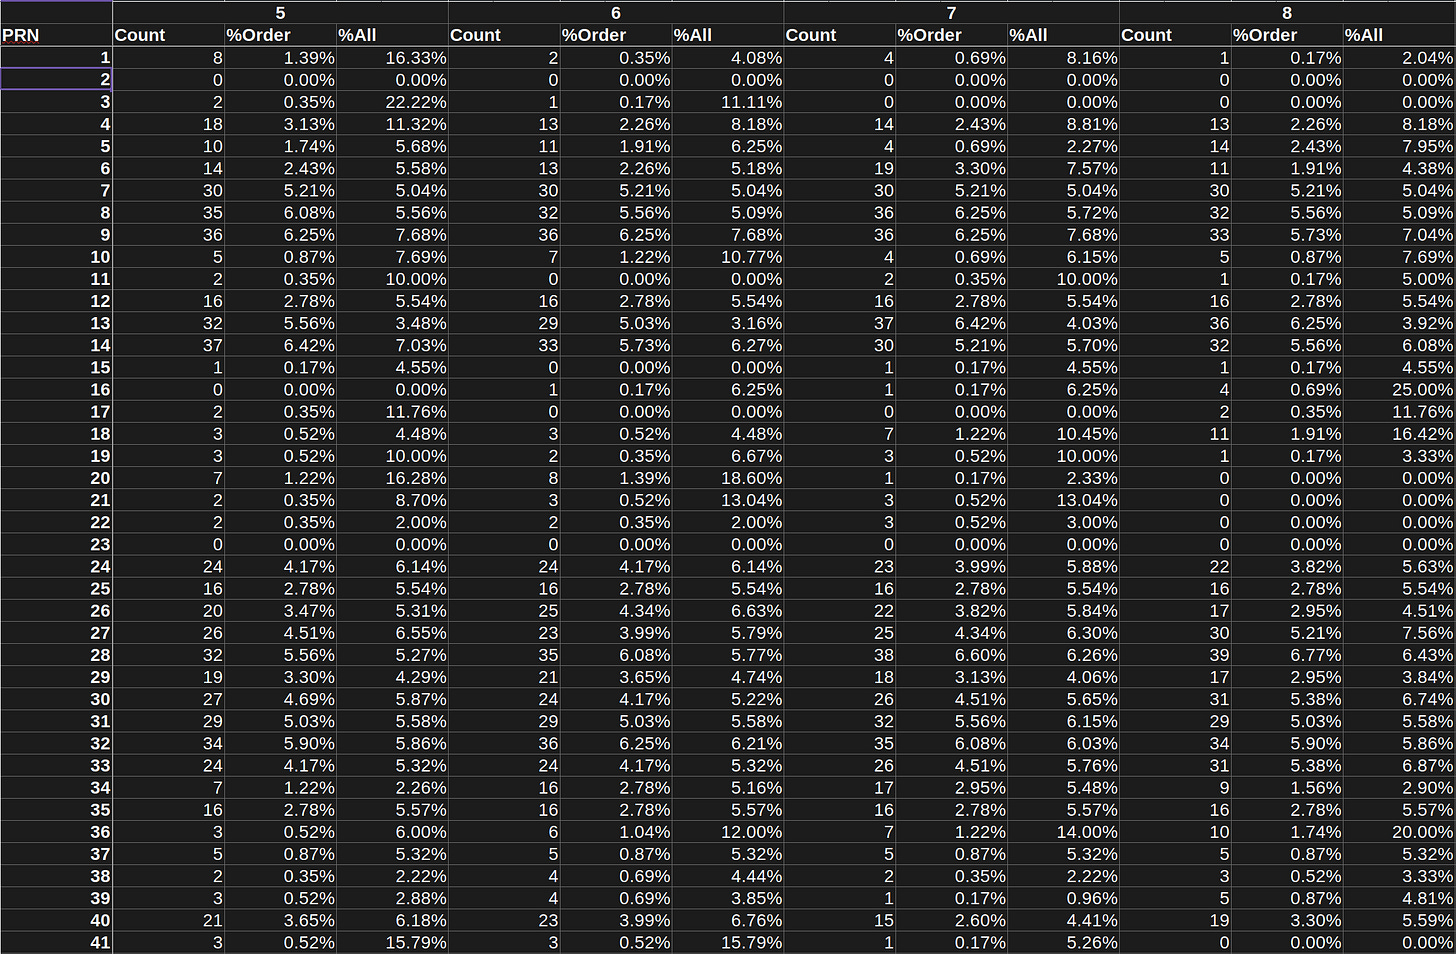
We can also take a look at play result distribution among batting order positions as listed on the lineup sheet.
Now, I don’t think we’ve got much significant here. I believe that Clifford Van Beek came up with the lineup sheet after he created the cards. However, it might be interesting to look at anyway:
Now, keep in mind that we’ve only got 288 players overall. 80 are pitchers, and another 80 are bench players, leaving us with 8 regular starters per team (128 players overall). Naturally, pitchers and bench players will account for most of the overall play result numbers, since there are more of them.
I don’t see any patterns here that we haven’t talked about already, though you’re more than welcome to interpret it as you like.
Play Result Numbers By Team
Finally, we can also look at the play result number breakdown by team.
Again, I don’t see much here with the naked eye. I’m interested to know if you might see any patterns.
More to come!


