The Automatic Playing Chart
Here’s another surprise from a very old issue of The APBA Journal: an automatic playing chart.
This is one of those things that comes in handy when you’re trying to do a single team replay, or a pennant race replay, and you need to figure out a way to play the games you don’t want to play by hand.
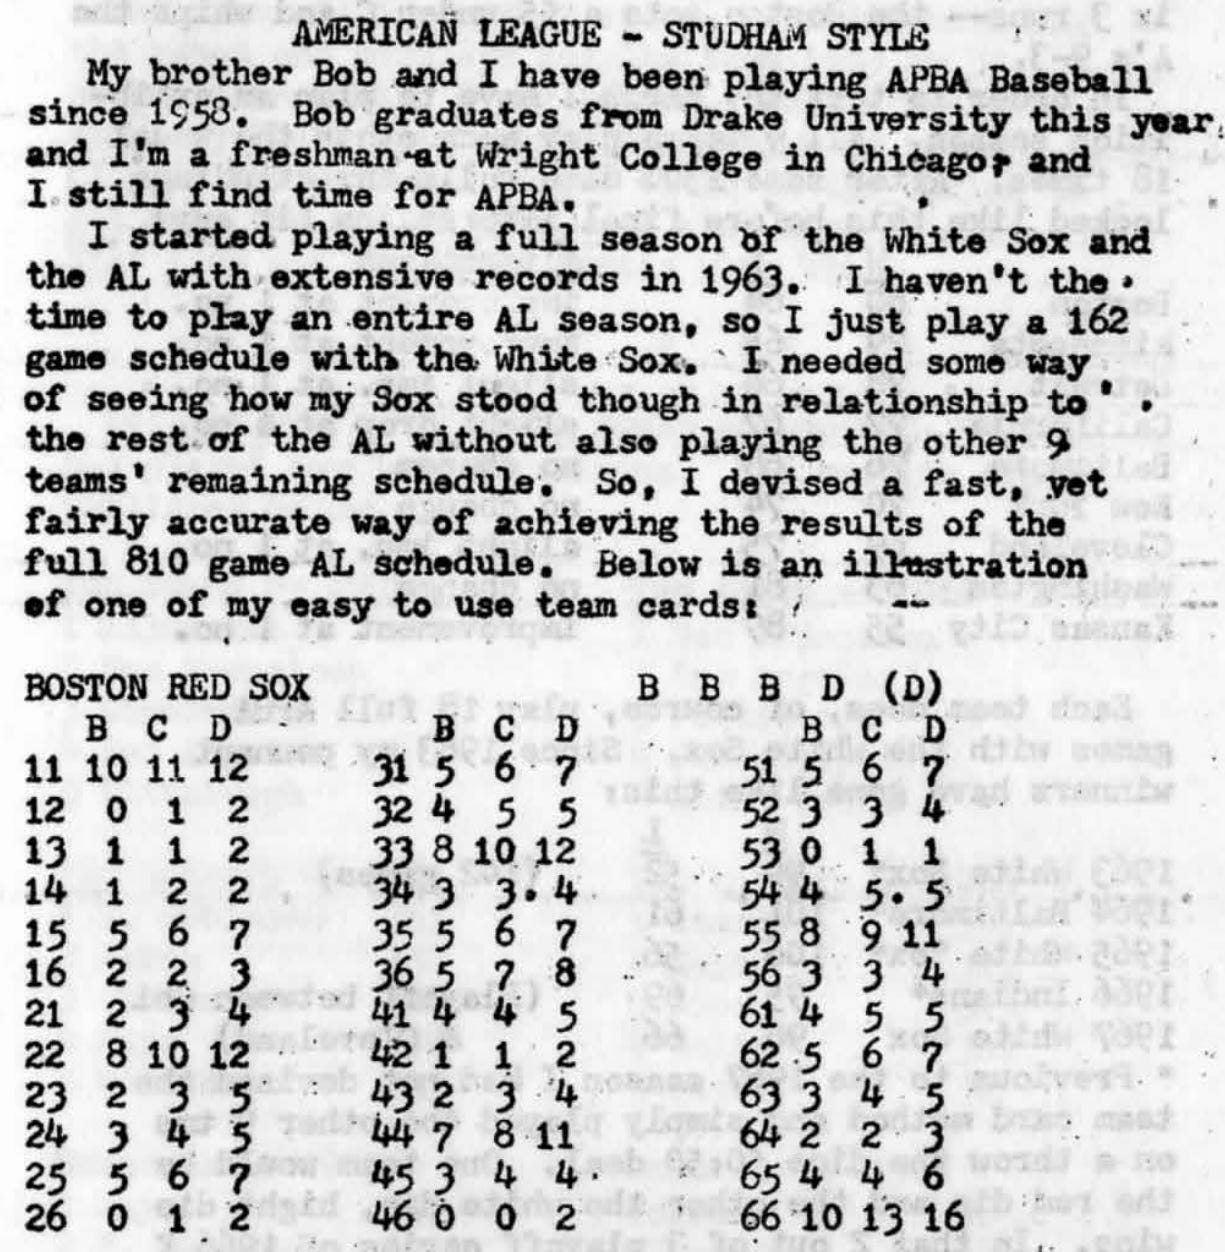
Now, the first thing you’ll notice is that this is quite similar to the charts that Replay baseball sells with its season sets. I’m not going to scan one of those, of course, since it’s proprietary information. The difference in this chart, of course, is that this calculates the number of runs scored, not the chances for a win — and it is differentiated by the grade of the opposing starter.
Here’s a bit more information:
It’s actually a really creative system. And, according to the statistics presented, it seems that it worked pretty well:
Unfortunately, the author (whose name is not given) did not explain how he came up with those APBA-like runs scored cards. Any ideas how someone could devise an updated version of a system like this?


