The First Baseball Replay — And A Mystery
Clifford Van Beek's Original National Pastime Replay
The First Baseball Replay
This one will likely surprise you.
The first baseball replay wasn’t some random APBA replay in the early 1950s. It wasn’t played with the old Ethan Allen spinner game.
Of course, I should define what I mean.
When we’re talking about a “replay,” what we mean is a project using representations of real life baseball players intended to somehow mimic what happened in real life.
There’s really no definition of “realism” or “real life” to use as some sort of gatekeeping mechanism here. However, there is a difference between the project we’re about to talk about and simply rolling dice and consulting one of the old dice baseball charts.
The difference, of course, lies in whether there are ratings that differentiate one player from another.
The first replay appears to have been conducted by Clifford Van Beek. And the evidence we have for it comes from his own promotional material.
The Pamphlet
Back in late 1930 and through all of 1931, Clifford Van Beek’s Major Games Company apparently responded to requests for more information about their flagship National Pastime game by sending them this pamphlet:
To be frank, I don’t know what the source is of these photocopies. I know that they were included with the various reprinted versions of National Pastime that were sold 20 years ago or so. I don’t know which copy of the game contained this pamphlet, however, nor do I know how many of these were made and spread.
Astute readers will recognize much of the language that J. Richard Seitz would later use for his APBA baseball game in this pamphlet. Van Beek clearly was trying to sell potential customers on the “scientific” nature of his baseball game. Though it might seem primitive to modern sensibilities to offer a baseball game with no pitching system, you’ve got to remember that the concept of having individual player cards itself had apparently never been done before.
There’s no question that this is authentic. The fonts are correct, the National Pastime board is set up correctly, and the nature of the dice is also correct. Most APBA fans think of one red die and one white die — and the traditional method follows Van Beek’s game, with the red die larger than the white. It wasn’t until the late 1990s that students of this game started to notice that it included two dice of the same ivory white color, one large and one small.
Of course, all of that is trivia for another day. It’s the statistical report on the back page that we’re really interested in.
The First Replay
There’s no doubt in my mind that this represents a full season replay.
It’s possible, of course, that Van Beek might have faked a replay with his own game. He could have used real life statistics for the most part, maybe playing out a game or two and making some tweaks to confuse the customer.
However, the stats tell a different story.
Let’s take a look at what he came up with, league by league.
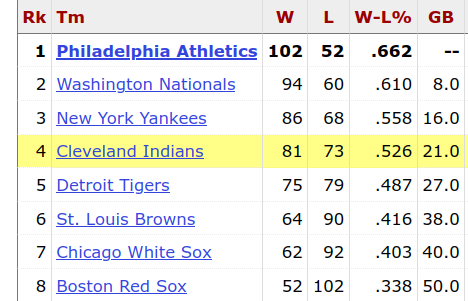
First, the American League:
The standings aren’t far off from what happened in real life in 1930:
Notice, of course, the differences. Philadelphia won 3 fewer games in the replay; the Yankees won 6 more. Boston won one less than in real life, the Browns won 4 fewer, and so on. We’re not seeing a smooth differentiation between records that might indicate that only a few games were played.
Now check out the team batting statistics:
Again — there’s not really any indication here that Van Beek faked a few games here or there to get the numbers right. The numbers of at bats are close, but are significantly off for certain teams (the White Sox, for example). The batting averages are also a bit off: the Browns and Tigers did a lot worse in the replay than in real life, the Athletics did substantially better, and the other teams were more or less the same.
If you’re curious, Van Beek reports 42,592 at bats in the American League portion of his replay, and 12,256 hits — both of which are incredibly close to the real life totals. That leads to a league batting average of .28775, which is basically spot on.
By the way, this likely settles the age old question of whether Van Beek based his game on the 1930 or 1929 season statistics. If it were based on 1929, his numbers would be far less convincing:
We can also look at the fielding statistics:
You’re probably wondering why we’d look at these. There’s no fielding system in National Pastime, of course. But, when you compare it to what really happened, here’s what you get:
With the exception of the Tigers, which I think feature a typo (5062 putouts would give them a fielding percentage of .97379; if you use 4062 putouts instead, it’s .96955, which gives us his .970 percentage rounded up), the numbers are spot on.
After making a small change for that typo, we’re looking at 32,654 putouts in the replay, 14,965 assists, and 1,568 errors, for an aggregate replay fielding percentage of .968.
Impressive, isn’t it?
I won’t go too deep into this, other than to say that Ruth, Gehrig, and Foxx came extremely close to their real life numbers of home runs, and that the batting leaders are quite similar to real life records, with a few exceptions.
Now the National League.
Interestingly, the Cubs won the pennant in the replay — another clue that we’re looking at an actual replay. The Phillies played quite a bit better, while the Braves played worse.
These offensive numbers are also quite close.
If you’re keeping score, Van Beek saw 43,220 at bats in his replay and 13,120 hits, for a composite batting average of 0.303563. He’s round it up to .304 if he were reporting it — but it’s still extremely close to real life.
Notice that the league batting averages for both leagues are right on, despite the disparity of almost 20 points between the leagues in 1930.
There doesn’t appear to be any typos in the National League fielding numbers.
Van Beek had 32,656 putouts, 14,773 assists, and 1,486 errors, for a fielding percentage of 0.96962.
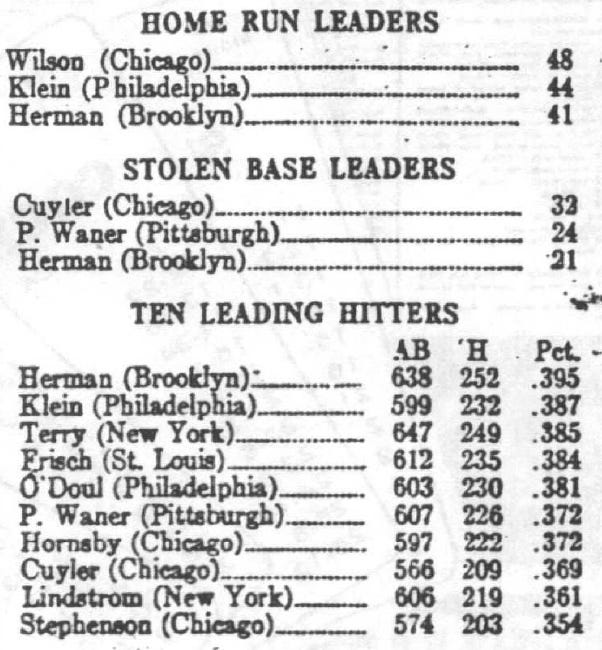
Finally, here are the leaders:
The only real thing of note here is Rogers Hornsby, who hit .372 for the Cubs in 597 at bats. In real life, Hornsby was limited to only 104 at bats in 1930, hitting .308. As others have speculated in the past, it is extremely likely that his card was based on his 1929 statistics, where he had 602 at bats and a .380 batting average.
At the very least, it’s clear that Van Beek didn’t bother to limit Hornsby’s playing time to reflect his real life injury. It’s possible that Van Beek was slightly biased towards the Cubs and wanted them to get that little extra lift to win the pennant.
The Mystery
That’s not all, believe it or not.
These numbers are impressive. I’m blown away by the fielding numbers in particular. I never would have thought that a game that has no fielding system would produce fielding percentages so close to real life.
But there’s a mystery here.
When was this pamphlet written? And how long did it take Van Beek to play this replay?
I’m convinced that the replay itself is legitimate. I’m also convinced that Van Beek had access to an archive of daily 1930 boxscores, since his recommended lineups so closely reflect the real life 1930 lineups.
What I don’t understand, though, is how in the world Van Beek could have played a full season replay between the end of the season in early October 1930 and the first advertisement for his game in mid-December 1930. He would have had to perform this task without any computers, and would have had to calculate his own statistics by hand — including those pesky fielding statistics.
Is it possible that this pamphlet was printed in 1931? It certainly is (note that there is no date on any page). However, it would also be impressive if he played the entire season in a year, or even just a little bit over a year.
For the sake of comparison, I’ve been working on my 1908 replay for over a year now, and am still in May. And that’s including all the help of modern technology!
What do you think happened? Any idea how we could solve this mystery?


