


Which OOTP Batting Stats Should We Pay Attention To?
Moving beyond scouting reports

Which OOTP Batting Stats Should We Pay Attention To?

After talking so much about how contracts, scouting, and all the rest works in OOTP, it’s time to look to the big question.
What stats should we be paying attention to? Or should we just forget about them and only trust in what our scouts tell us?
This is important, of course. Those of us who don’t spend a lot of time in the minute details of these games tend to rely on the star ratings as a sort of shortcut. You figure that a young player with, say, 2 stars of current ability and some potential should be in the major league team. Guys with 3 stars are of major league level, and anybody above that is your star.
But, of course, this doesn’t tell you much about whether your players are capable of reaching their theoretical potential — or even all that much about their current ability.
There are two problem you’ll always run into:
Your scouts and coaches are impacted by the “fog of war” and aren’t always accurate; and
Hidden gems — players who are much better than your scouts and coaches think — are absolutely a thing.
Now, OOTP is different than most of the stat based games many of us grew up playing. OOTP focuses less on recreating raw statistics and more on using those raw statistics to create a series of ratings. Because of that, most people who talk about interpreting scouting ratings focus on those raw ratings, as evidenced by discussions like this.
Honestly, though, it seems to be mostly guesswork — and that includes the advice given by the various gurus on YouTube.
I’d argue that you’re better off learning which statistics to look at and how to interpret those statistics correctly. And, yeah, that does mean dipping your toe a little bit into the world of sabermetrics.
Now, the obvious candidate is WAR. But WAR is pretty complex, and is going to take us more than a single blog post to dig through.
Long gone are the days when we’d argue over players based on batting average, home runs, and runs batted in.
Now, there’s one thing that we need to make clear right away. Those traditional metrics are not worthless. They tell you something about what a player does. They measure something that actually happens on the field, without any extra fiddling to incorporate park effects, era effects, adjustments for the player’s position, or any of that silliness. The attraction of the basic counting and rate statistics is that they tell you exactly what happened. They’re simple and are easy to understand.
So why worry about adjusting things? Why mess with tradition?
The reason is because statistics can be misinterpreted. A hitter in a great hitter’s ballpark — Coors Field, for example — might hit a few more home runs than he would in the Astrodome. J.R. Richard, who was dominant in the Astrodome, might not be so dominant in Coors Field.
Or we could be wrong. Maybe a time traveling J.R. goes to the 1995 Rockies and turns them into a pennant contender. Maybe Dante Bichette surprises us and leads the league in home runs for the 1968 Astros. That’s why we play these games, after all — to get an idea of what would happen if we make just a little change here and there.
Anyway, adjusted statistics help us eyeball things — they help us get an idea of how good a player likely is independent of other factors. We’re talking about how good a hitter is after we’ve factored out how much his ballpark has hurt or helped him.
Now, in OOTP we have quite a few stats to choose from — both traditional and more advanced:
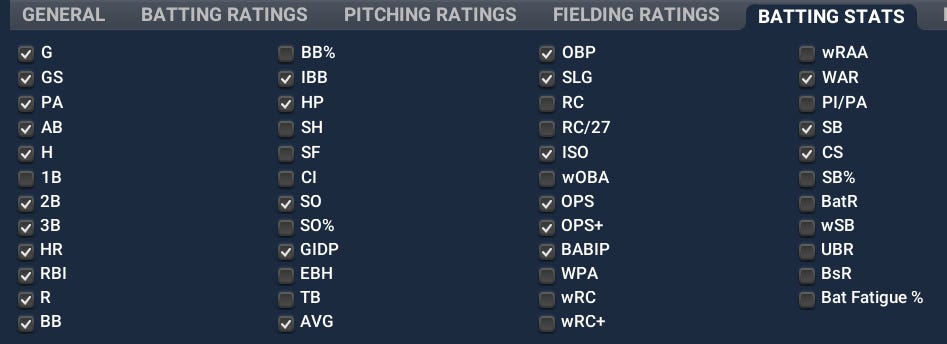
After doing a quick review of what people have said on the subject, I’ve discovered that most tend to favor either OPS+ or wRC+ for basic batting statistics, followed by the ever elusive BABIP.
OPS+ and wRC+ measure practically the same thing. I know those are fighting words, and I know it’s not wise to write something like that on the internet — but it’s true. A few years ago, Baseball Prospectus showed that OPS+ and wRC+ are extremely closely correlated:
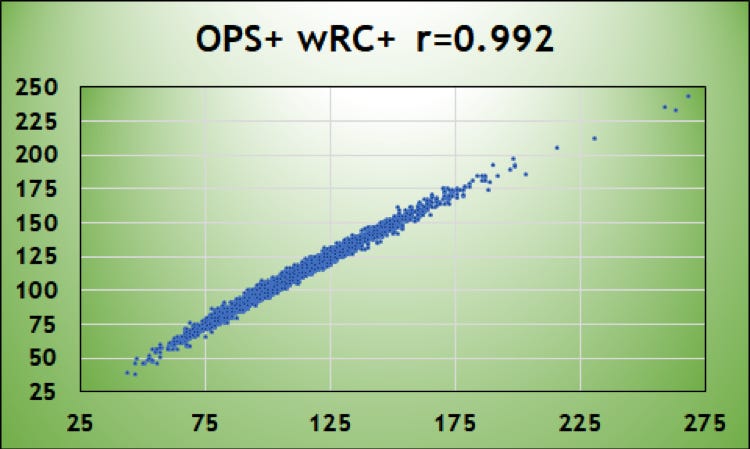
This was in an article promoting Deserved Runs Created, a metric that, to my knowledge, has never really caught on.
We won’t get deep into the math here — but, if you look at how OPS+ and wRC+ are formed and compare them, you’ll see the correlation. They’re measuring practically the same thing the same way. If I were forced to choose between the two, I’d probably choose wRC+ because of the extensive research Tom Tango did to choose the linear weights.
The next stat you’ll see people talk about is BABIP, which is one of the newer stats that drive traditionalists nuts.
The concept behind BABIP is actually pretty simple. It measures how often batted balls result in hits — but it excludes home runs. It’s basically what a player’s batting average is excluding home runs and strike outs.
In fact, the equation makes that clear:

See how home runs and strikeouts are subtracted? Meanwhile, we add sacrifice flies back in on the bottom because the batter hit the ball.
We ignore home runs because those aren’t balls in play. We also ignore bunts because it’s seen as a deliberate out.
Basically, BABIP is an attempt to measure a player’s ability to make contact, which is why it can be useful in an OOTP context. Sure, you’ve got a Contact rating — but that’s just your scout’s opinion of what the player’s Contact rating is, or the coach’s opinion. You can use BABIP as a quick reality check to make sure you’re actually seeing what you think you’re seeing.
The other thing to remember about BABIP is the concept of regression to the mean. Basically, this means that a player who has a really high or really low BABIP might just be having good or bad luck. This is especially true for pitchers — but we’ll get to them later.
The regression to the mean concept in BABIP is discussed in quite a few places on the internet. Check out this old article from PitcherList, for example. In fact, if you really want to have fun, compare author Daniel Port’s predictions with what really happened in 2019. Turns out he was right.
If you’re worried about the BABIP of a minor league hitter being impacted by their ballpark or league, move them to another minor league team and see how they do over time. BABIP is the sort of statistic that will bring you close to the “truth” of the player’s contact ability after you’ve looked at it in different contexts over the course of a few seasons.
Now, there’s more that we can talk about. Some people like looking at SO% and BB% (strikeout and walk percentage) for a quick look at whether a hitter has a good eye, for example. You can mess around a bit with those statistics and see what you like the best.
Daniel,
Your articles on OOTP are very helpful. I have preordered the 2025 version and I am relying on your articles for advice.