Estimating Pitch Counts
Every now and then I see something so good that I know it needs to be spread.
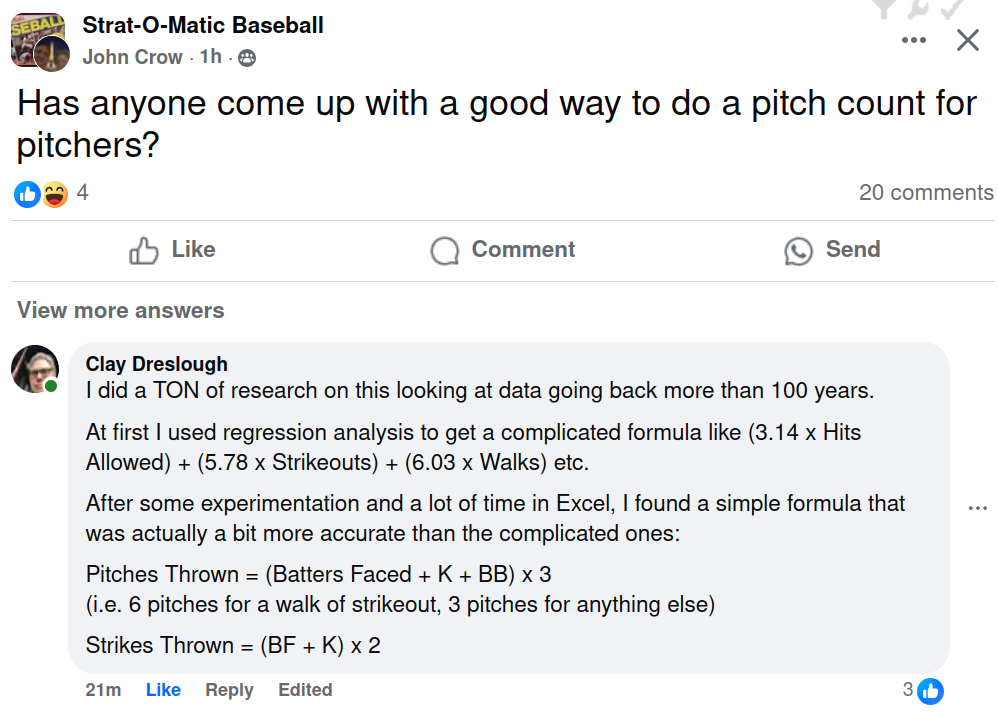
This came up on Facebook a few days ago:
If you’re not already aware — Clay Dreslough (who reads my writing from time to time) is the creator of Season Ticket Baseball, as well as Baseball Mogul. I’d say that he knows a thing or two about this sort of thing.
The cool thing, of course, is that we can test this theory out.
Let’s look at Pedro Martinez in 1999, for example. Now, I’d forgotten about this, but Pedro only walked 37 batters all season, and managed to strike out 313. He faced 835 batters.
This formula estimates that he threw 3,555 pitches. It also estimates that he threw 2,296 strikes.
Now, since it’s 1999, we happen to have complete pitching logs to test this. In real life, Martinez threw 3,321 pitches. Our estimator is pretty good; it’s within 7% of his real life total.
Baseball Reference only tells us that about 66% of his pitches were strikes. I think that means around 2,346 strikes all season; I didn’t take the time to add together the strikes from every single game. The estimator came up with 2,296 strikes, which is a difference of only about 2.2%.
That’s pretty impressive.
Now, I don’t know if this estimator is valid for all of baseball history, though I’m guessing that it’s as good as anybody else’s guess. We can play with it, after all.
Nolan Ryan faced 1,356 batters in 1973, striking out 383 and walking 162. The estimator guesses that he threw a whopping 5,703 pitches that season, 3,478 of which were strikes. At 5,703 total pitches and with 41 appearances, he would have averaged just under 140 pitches per appearance — and remember that two of those appearances were in relief!
Walter Johnson faced 1,418 batters in 1910, back when it really took stamina to be a starting pitcher. He struck out 314 and walked only 78. We get 5,430 pitches, 3,464 of which were strikes. Johnson appeared in 45 games, which means he had a little under 121 pitches per outing — maybe not quite as extreme as you might have expected.
In what might be the most incredible pitching season in all of post-1900 baseball, Ed Walsh faced 1,774 batters in 1908, striking out 271 and walking only 56. The estimator has him at 6,303 pitches for that season (which is probably a record), 4,090 of which were strikes. Big Ed appeared in 66 games that year (49 of which were starts; he frequently started on two days rest), which means he had about 96 pitches per outing.
That should surprise you, of course. It turns out that Big Ed wasn’t throwing a Nolan Ryan every single time out after all. Even if you had some way to discount the pitch counts of his 17 relief appearances, the 49 starts certainly weren’t 140 pitches each.
Now, I suspect that the pitch count estimates for older seasons are slightly inflated, and that the pitch count estimates for more modern seasons will be a little bit bit high. This is because foul ball rates have increased over time, thanks to changes in how the bat is shaped and how weight is distributed. I’m not saying that Home Run Baker would have hit 80 home runs per season with the torpedo bat, but I am saying that it makes a difference that we have a hard time calculating.
Even saying that, however, I think this is a great place to start from when it comes to pitch count estimates. And, if you can figure out what pitch counts were probably like, you can also figure out how pitcher fatigue has changed over time — something that could make your games more accurate and could help us figure out new ways to study fatigue and rest in the past.
Lots of good stuff here!


I love Clay's idea. For the last year or so, I have used a pitch-count formula I saw on the APBA Baseball Facebook page:
It is 3.3 pitches per PA + 1.5 for each Strikeout + 2.2 for each Walk.
And it works pretty well. In my current GTOP tournament, I limit each starter.. he cannot face a new batter once he reaches 110 pitches. As a result, most starters have to come out by the 7th or 8th inning. It forces me to make strategic use of bullpens, which I really enjoy. Roughly one of every 25 starts still results in a 9-inning complete game.
But Clay's formula is much simpler. And I'm stunned at how accurate it appears to be.
Just for fun, I just grabbed a random pitcher for a quick test. Don Sutton of the 1988 Dodgers..
Real life:
375 BF
44 K's
30 Walks
1,337 Pitches
827 Strikes
Using Clay's formula:
1,347 Pitches
838 Strikes
My mind is officially blown.
Great job, Mr. Dreslough.
Fascinating!