National Pastime Expected RBI
Apologies for the spate of National Pastime posts. I’ve stumbled across a lot of interesting things that I really think need to be shared.
I’m pretty sure that Clifford Van Beek had access to player specific RBI totals at the end of the 1930 season. I was curious about whether he gave out play result numbers 7, 8, and 9 based on those RBI totals. However, I didn’t have a good way of separating those numbers from the other play result numbers that yield RBIs. In the end, I decided to create a rudimentary system to predict RBI totals in National Pastime.
As was the case yesterday and the day before, we’re using the on base situation probabilities we calculated a year or so ago based on Baseball Reference data. Our numbers aren’t exactly correct, but they’re probably very close to whatever it is that Clifford Van Beek actually used. You can read more about that here:
RBIs are actually pretty easy to predict in National Pastime. Play result number 1 is obvious: it’s always a home run, and therefore will always result in at least 1 RBI. Extra RBIs are added for each runner on base.
I created this chart to keep track of RBIs for power number rolls, based on the National Pastime boards:
All triples and home runs clear the bases of existing runners, of course.
Here’s a similar chart for singles:
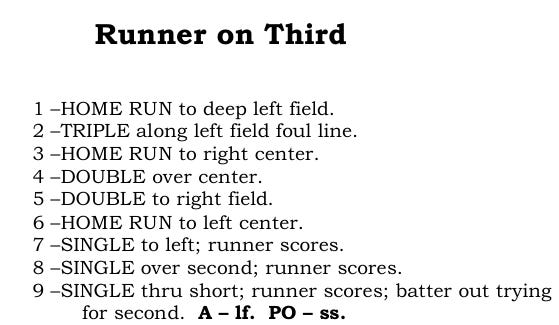
Play result 9 is usually described on the boards as an infield hit, and results in the runners moving slowly around the bases. The big exception is a roll of 9 with a runner on third, which results in the batter being thrown out at second:
7 and 8 are similar play result numbers, except that 7 frequently allows the batter to reach second base.
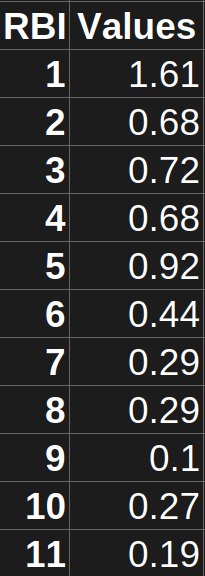
Based on these values and the base situation frequencies we calculated earlier, we can calculate expected RBI totals for each hit number:
Note that 5 is the second most powerful number in terms of runs batted in due to the frequency with which it turns into a home run.
We saw yesterday that the expected home run values for each player matches their real life home run totals very closely. As a result, I believe that Clifford Van Beek purposely used 5 as a “light” home run number — a number that would be turned into a home run a significant percentage of the time to help account for players who didn’t have enough home runs to justify receiving play result number 1.
When we crunch the numbers, we get RBI totals that are somewhat close to real life, though seem to be a little bit low:
Of course, this doesn’t take into account the frequency with which each of these guys is going to actually have runners on base. It’s certainly possible that Hack Wilson and Lou Gehrig will see more runners on base than average — and it’s kind of hard to figure out a simple way to account for that. We might have to dig in a little bit deeper.
At any rate, I’m starting to suspect that a 1930 replay using National Pastime might give runs scored totals that are a bit behind where they were in real life. That surprises me, especially considering that there is no pitching system to speak of.
What do you think? Is there something I’m not accounting for? Have you tried a National Pastime replay yourself - and do you have results to share?


I believe you've missed RBIs from non-hit results.
LOVE...!
The NPiii posts...so interesting.