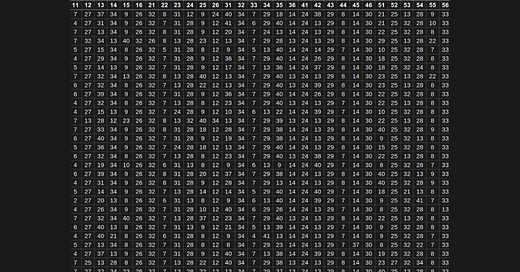
National Pastime Play Result Numbers
Last time I talked about checking the play result numbers against the boards to get a better idea of how frequently each National Pastime on-base situation is likely to come up.
It’s actually a little bit more complicated than that.
National Pastime is a game of patterns. As we start really digging into the cards that Clifford Van Beek created, the patterns will become increasingly obvious. Those patterns are most obvious when we start looking at the placement of out numbers. I believe that they also shed some light into Van Beek’s thinking when he created the game.
But enough description — let’s get cracking.
Play Result Frequency
I’ve got a master spreadsheet that features every single player card in National Pastime.
It isn’t as complicated as you might think. There are 18 players for 16 teams, making 288 players in all. Each card has 36 dice roll results. That gives us a total of 10,368 individual play results — a bit daunting, but certainly not impossible for modern spreadsheet software.
If we look only at the frequency of each of those play result numbers, we get something like this:
Now, I need to pause for a second here to make a comment.
Long ago there was a famous man, well known in the APBA and Strat-O-Matic communities, named Robert Henry. Henry had a copy of every single APBA and Strat-O-Matic baseball card in existence, and was well known for his encyclopedic knowledge of both games. He also knew many key players behind the scenes, and knew things about the inner workings of both companies that never cease to amaze me.
Henry posted on the APBA Between the Lines message board back in 2002. He posted only for a short time before fading back into obscurity. He wound up passing away in 2006.
Henry was one of the APBA fans who met with Clifford Van Beek in person back in the late 1970s. And, as it turns out, Henry had his own set of strong opinions about APBA, National Pastime, and the makeup of the game itself.
The internet is a strange place. You can read Robert Henry’s message board posts as if he made them yesterday. You might even feel a strong urge to reply to him, especially after you read this take:
Now go back up and look at that chart again.
If you ask me, play result number 3 was already obsolete by 1930. There were only 9 “3” results in all of National Pastime, making up a whopping 0.09% of all play result numbers.
The only number with fewer results? That would be the 2, which is actually a triple more often than a 3. There were only 5 “2” results, making up 0.05% of all play result numbers.
Play result “4” is the most common of the so-called “three triple numbers.” However, “4” should not be thought of as a “triple number,” since it is a double with the bases empty.
I should also note that “5” is not a “homerun number” — not any more so than 2, 3, 4, or 6. Each of these play result numbers is a home run in National Pastime in certain on base situations. With the bases empty (which we established is the most often base result situation), a 5 is a double.
Robert Henry was very kind to share his knowledge with others. However, it’s clear to me from this post (and others like it) that he had absolutely no idea how the National Pastime boards actually worked.
Other Notes
There are a few more interesting things to note:
Play result numbers 15-21 (all commonly thought of as error numbers) are actually quite rare on their own. There might be a pattern to how these were assigned.
Play result number 10 is more common than 11. Again, there’s probably a pattern here, presumably something connected with stolen bases.
Play result number 36, which we noted earlier never results in a plate appearance (see this post), is also pretty rare, occuring only 0.48% of the time.
Play result number 41 only occured 19 times. I’m honestly not sure what role it is supposed to play in National Pastime. It’s rare, the results don’t really follow a pattern, and it sticks out like a sore thumb — sort of like result 12.
More to come.


