Play Result 40 In National Pastime
Play result 40 is kind of odd.
In APBA and its derivative, it’s seen as one of the “unusual play result numbers.” I don’t think many people consider it any more than any other play result between 36 and 41. In fact, most modern iterations of the game engine include some sort of randomization tool to give ever hitter a shot at hitting one of the unusual play result numbers.
It seems to be different in National Pastime, however.
Believe it or not, play result number 40 is actually one of the most frequent play results in all of National Pastime:
Now, it’s easy to understand why some of these play result numbers are common. 13 is always a strikeout, for example, and 14 is a walk. It’s not strange to think that there would be quite a few of these (though it’s not clear that these match up well with real life statistics, as we explored here and here). 7, 8, and 9 are all singles. 30, 31, and 32 are fly balls to the outfield; 24, 26, 27, 28, and 29 are infield grounders; 33 is usually a pop-up.
But isn’t it odd that there are more 40s in National Pastime than play result number 34? Every player has one 12 (one player has two); every player has one 25 (one player has two); almost every player has one 35 (one player has none). And yet there are more 40s floating around than any of those numbers.
Not everybody has a 40. 5 players were given none. 4 players were given 3. 49 players had 2, and the bulk of the players received a single 40.
For those who might be interested, here is how 40 was distributed:
40 frequently takes up a “hit roll” slot. Sometimes it takes up dice rolls usually reserved for play result 14, such as dice roll 13, dice roll 35, dice roll 61, dice roll 64, and, on very rare occasion, dice roll 45.
40 stands out. But why?
The Boards
In National Pastime, 40 is almost always a sacrifice hit:
With none on base it’s a foul ball — basically the same thing as a reroll.
With a runner on first it’s a bunt to the pitcher, advancing the runner to second.
With a runner on second it’s a sacrifice fly ball to right field, advancing the runner to third.
With a runner on third it’s a sacrifice fly to center field, scoring the runner.
With runners on first and second it’s a bunt to the third baseman, advancing the runners one base each.
Runners on first and third is different. It’s a ground ball to the pitcher, who throws to first for the out. Both runners move up. Remember — there’s no option to play the infield in. Perhaps Van Beek intended for this to be a sacrifice?
With runners on second and third it’s a sacrifice fly to right field, advancing both runners.
And with the bases full it’s a sacrifice fly to left field, advancing only the runner on third.
If we assume that Van Beek accidentally left the “sacrifice” language out of the text with runners on first and third, we can conclude that the 40 largely served as a sort of buffer number. In other words, by adding a 40 or two or three to a player card, Van Beek could do a little bit of batting average fine tuning. After all, sacrifices aren’t charged as times at bat.
Play result 40 seems to have been used to allow Van Beek to fine tune batting averages.
Examples
Let’s look at a few specific examples. This is going to be very basic; apologies to those who think this is overly simplistic.
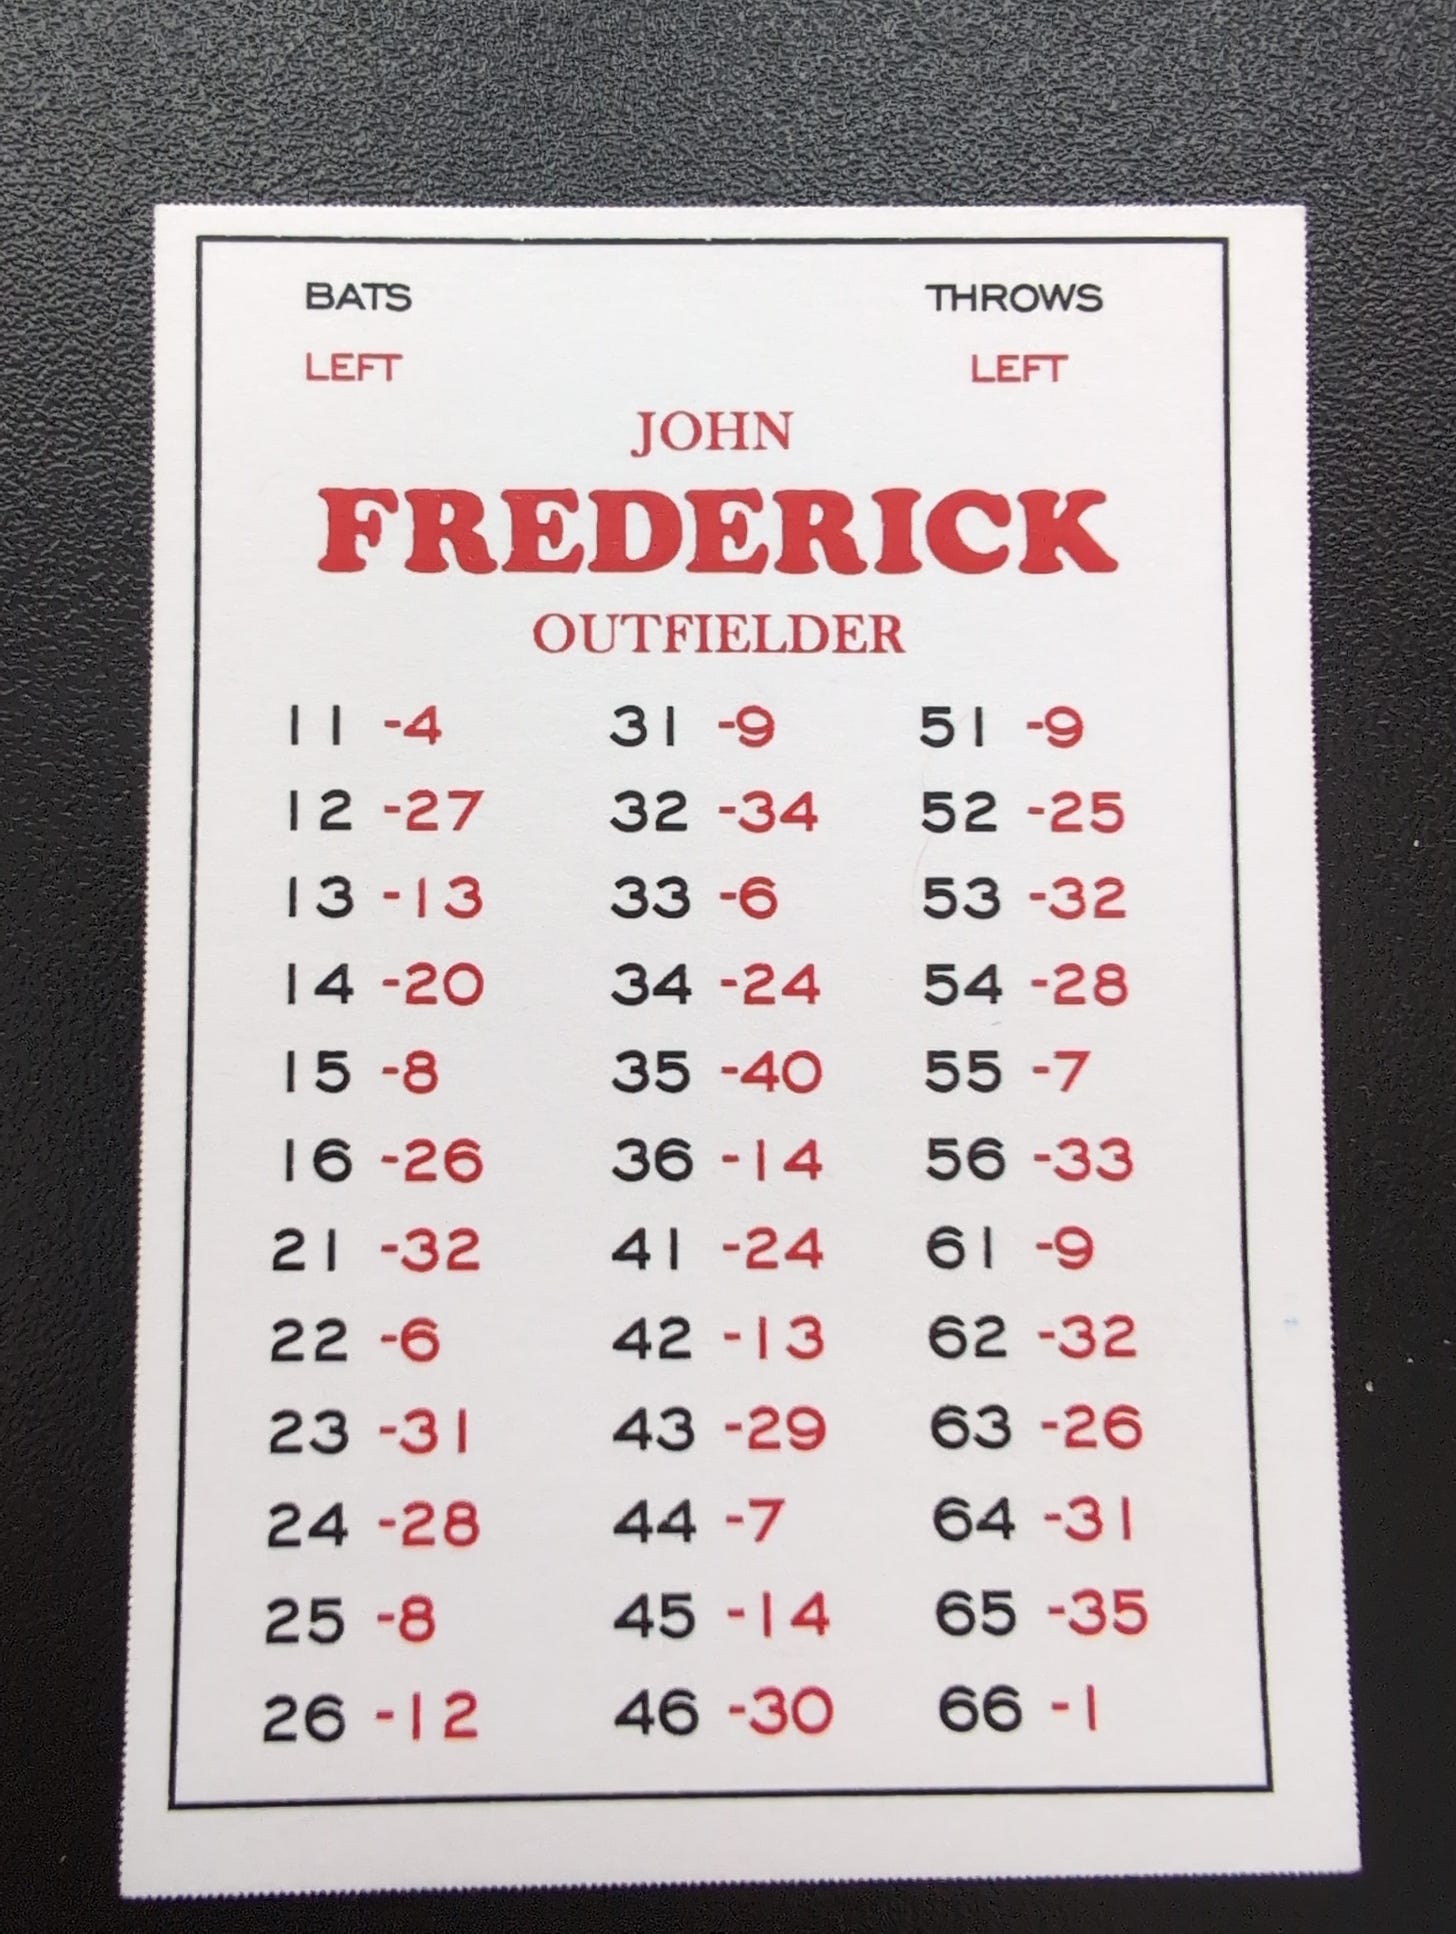
John Frederick of the Brooklyn Dodgers has a pretty typical left handed hitter’s card:
In 1930, his second full-time season, Frederick hit .334. If you’d rather think about his 1929 season, you’re in luck: he hit .328, which is really close enough for our purposes here.
Now, the following play results on Fredrick’s card never count as an at-bat:
Examples14 on 36
14 on 35
40 on 35 (ignore the first and third exception for now)
Frederick also has 11 dice rolls that always result in a hit:
4 on 11
8 on 15
6 on 22
8 on 25
9 on 31
6 on 33
7 on 44
9 on 51
7 on 55
9 on 61
1 on 66
There are 36 dice rolls on his card. However, only 33 of those rolls result in at-bats.
With 11 hits out of 33 dice rolls, we can see that his card is designed to hit .333. It works well whether you think the card is based on his 1929 stats or his 1930 stats.
What if he had a “normal” out result on dice roll 35? He’d then have 11 hits in 34 dice rolls, which gives us an average of about .324.
In other words — that play result 40 allowed Van Beek to fine tune the card a bit.
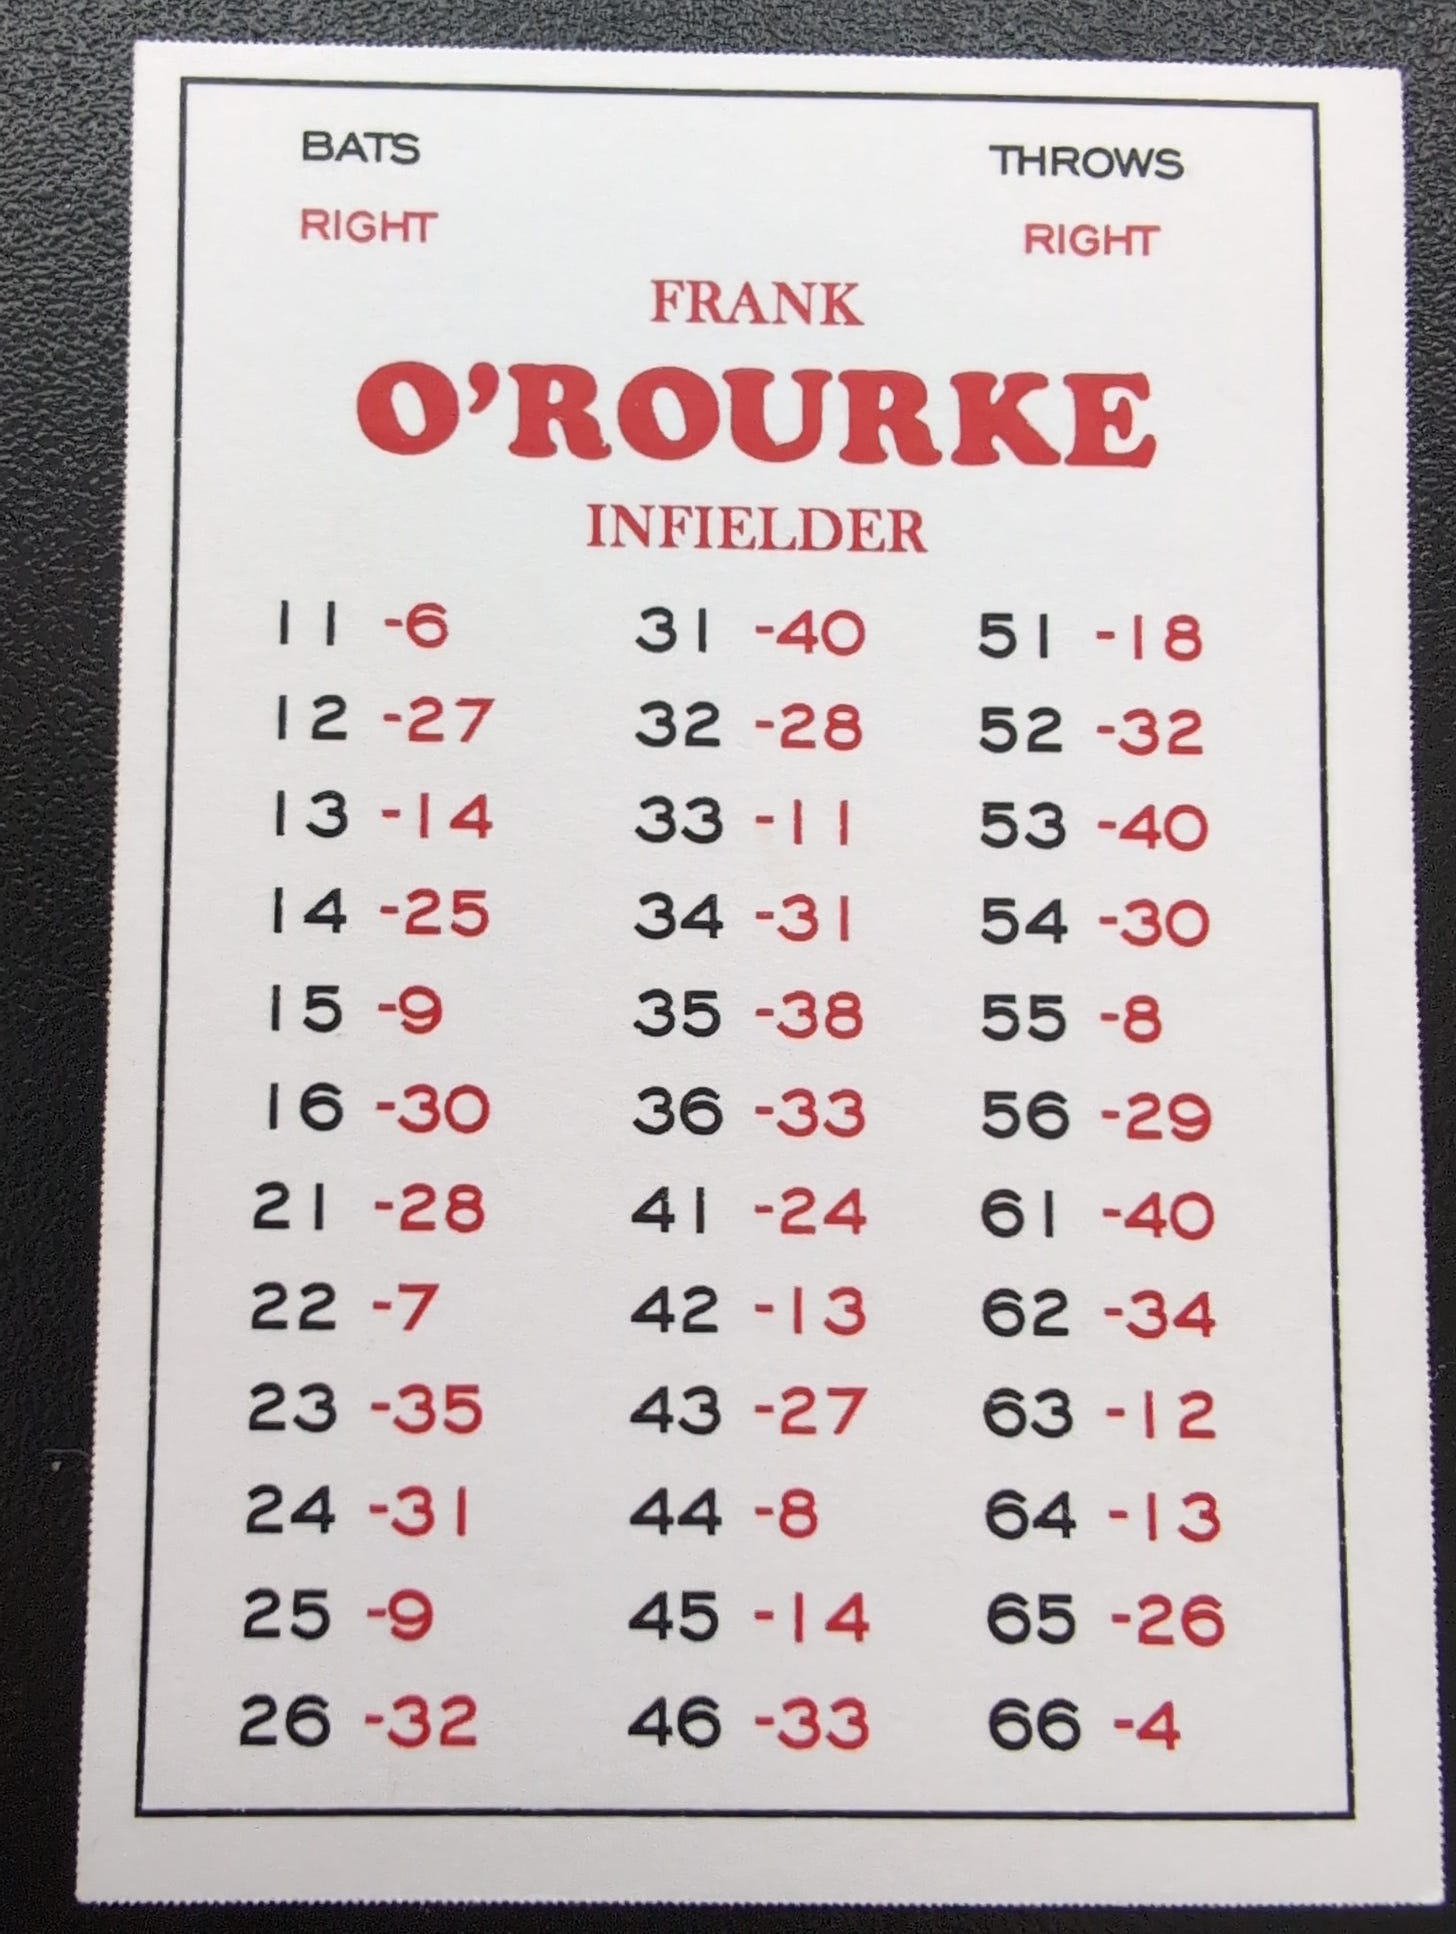
Let’s look at a more extreme example. Frank O’Rourke of the St. Louis Browns is one of four players to receive 3 40s:
O’Rourke had 2 14s and 3 40s, meaning that 31 of the 36 play result numbers resulted in at bats.
O’Rourke also had 8 hit numbers, including a relatively rare 11 (he stole 11 bases in 1930 at age 38).
8 hits in 31 play results gives us an average of .258. O’Rourke hit .268 in 1930 and .251 in 1929. In my opinion, the card works for either year — and also works well if you consider it an average of the two seasons.
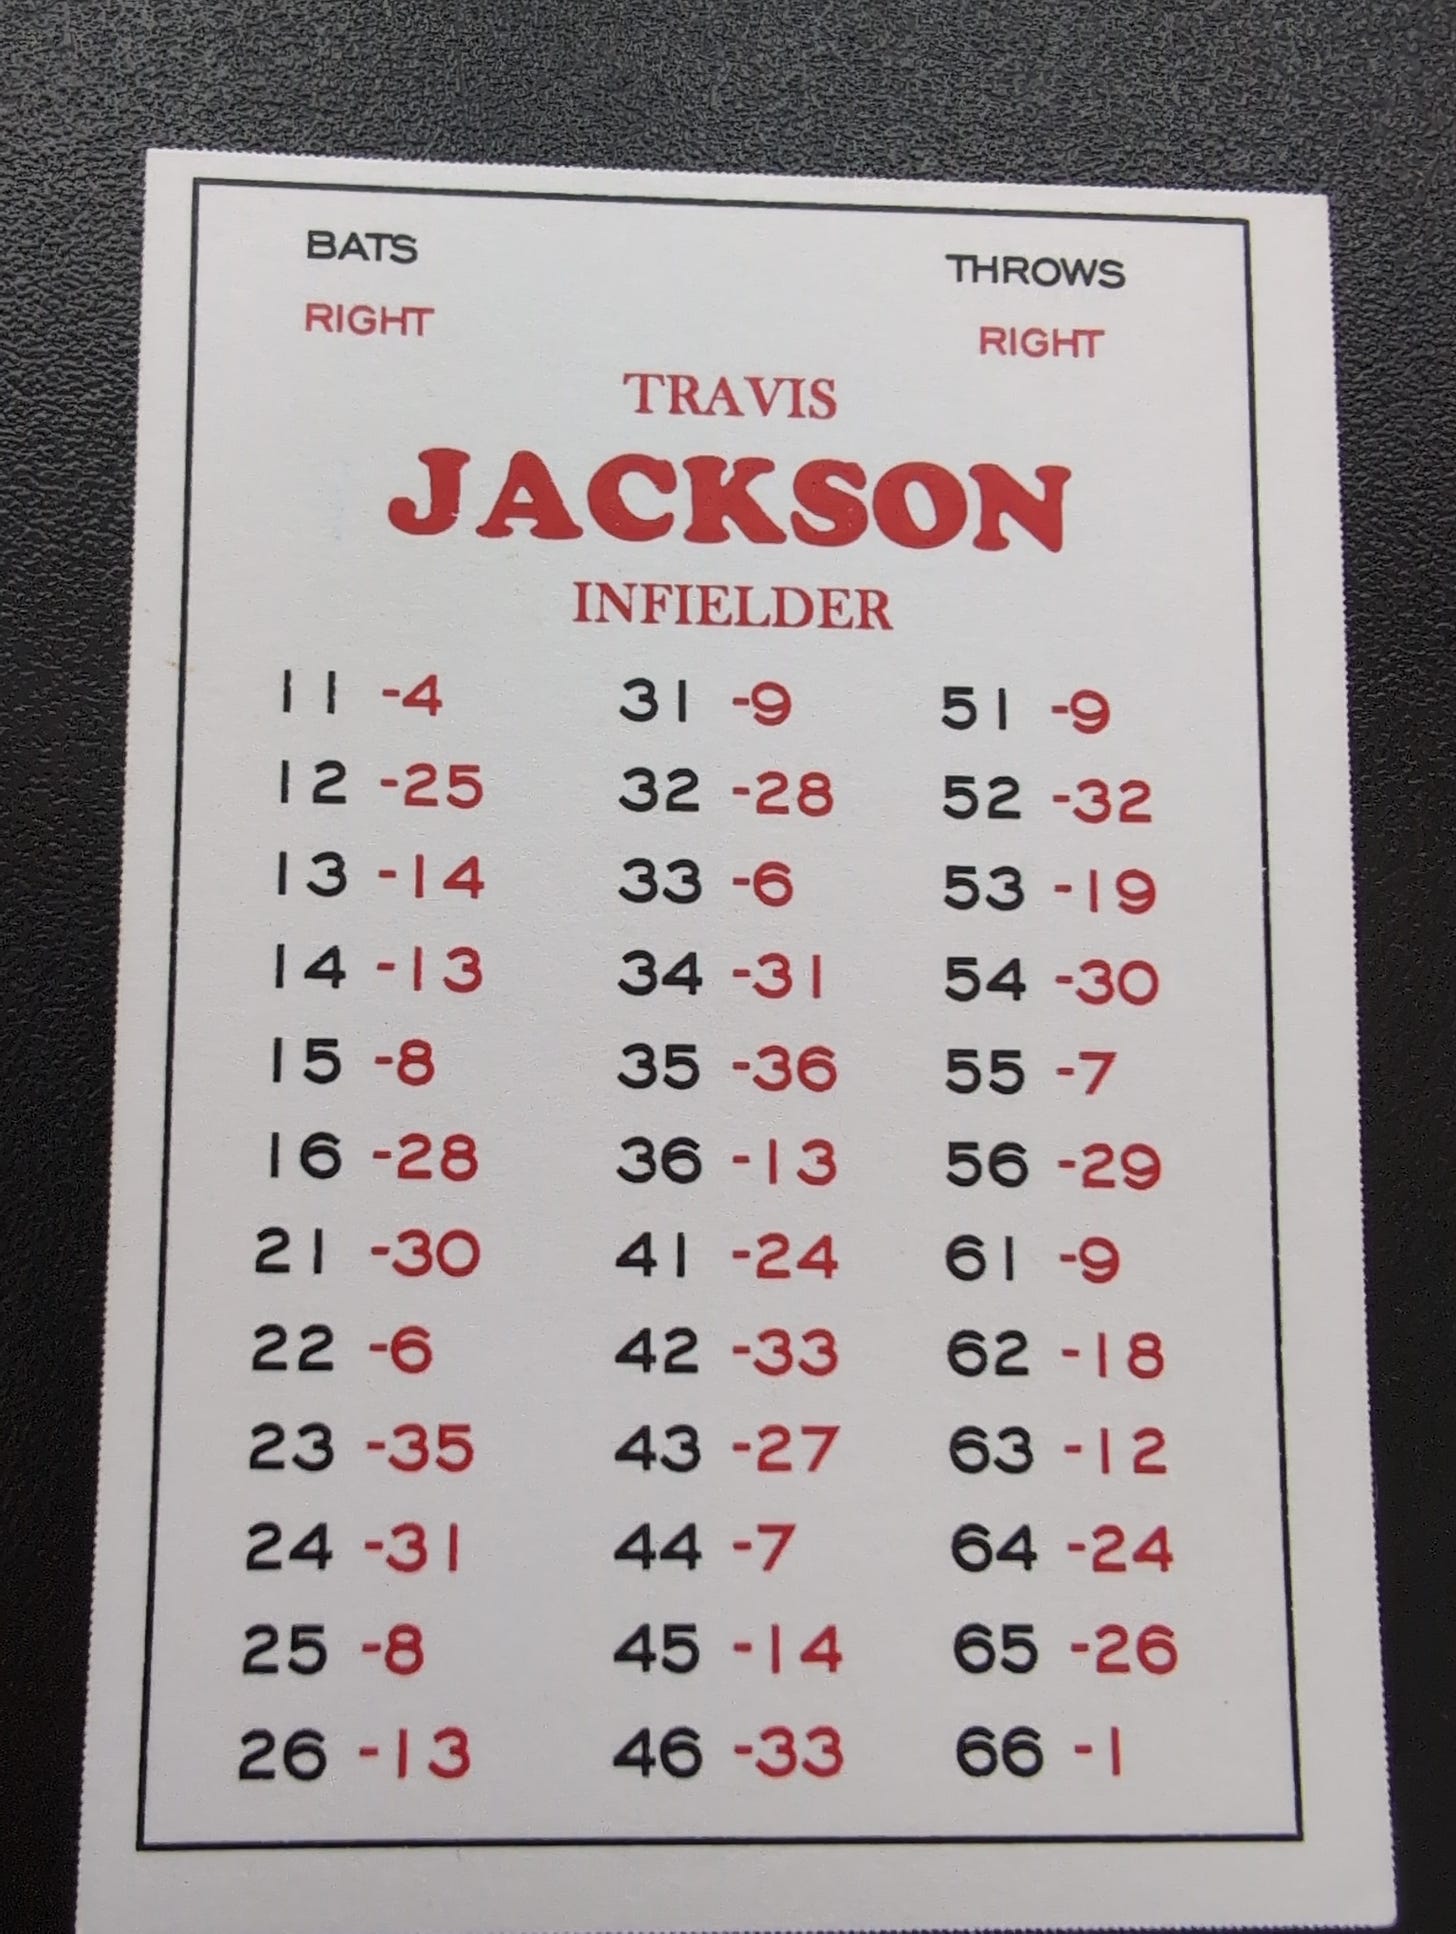
Finally, we’ll look at Travis Jackson of the New York Giants, one of 5 players to receive 0 40s:
Jackson had 2 14s. He didn’t receive a 40, but he did receive a 36 — one of only 50 players to receive one (out of 288 total players). He and Thomas Thevenow of the Philadelphia Phillies are the only two players to receive a 36 but no 40.
Now, 36 is interesting. It’s a ball with nobody on base, and is either a wild pitch or a passed ball in all other base situations. In other words, like play result 40, it does not charge an at bat to the hitter.
We’ll look later at the distribution of play result 36. For now, we just ned to understand that there 33 of the 36 dice rolls on Jackson’s card charge him with an at-bat.
He has 11 hit numbers, giving him a card that should hit .333. He hit .339 in real life in 1930 — again, close enough for a game like National Pastime. He hit .294 in 1929, for the sake of comparison.
Now, if 36 did not take away an at bat, we’d have 11 hits out of 34 possible at bats, for a .324 average. On the other hand, if one of Jackson’s outs were changed to a 40, we’d have 11 hits out of 32 possible at bats, for a .344 average.
You could make a case that Jackson should have had a 40 on dice roll 53, instead of having both play results 18 and 19. It’s possible that we’ve discovered a mistake — assuming that Van Beek was trying to get as close to the 1930 batting average as possible. However, keep in mind that only one card received play result 40 on 53. Van Beek preferred to give out 40s on “hit rolls,” as shown above.
At any rate, this gives you an idea of what role results like 40 played. We’ll look closer next time at play result 36 to see what patterns we can find in how it was distributed.


