Searching For The Math Behind Rfield
I’m going to get in trouble for this post. But I’m going to write it anyway.
If you don’t know, Rfield is one of the components used on Baseball Reference to calculate WAR.
Surely you know what WAR is, right? It stands for Wins Above Replacement, and has become the statistic for internet baseball debates. I wrote a little piece about it here, one that has been roundly ignored:
Interesting — But Useful?
WAR and Replayers Let me preface this by saying that I am far from a statistical expert. I love baseball statistics, just like any other baseball fan. However, I’m not one of those guys who hangs out on stat-heavy forums, throwing around complicated acronyms and belittling anybody who would dare use a “traditional” baseball statistic.
Of course, I haven’t learned my lesson yet, which means I’m about to write another long article about a subject I know nothing about that nobody will read.
Now, when arguments about WAR come up online, a large percentage of baseball fans call it a “made up stat.” The general response is to call these (typically older) fans luddites, at which point civil discourse breaks down completely.
Having studied the issue, I’m starting to believe that there actually is truth to that “mae up stat” claim.
Dave Parker in 1986
These dicussions are boring if we keep them abstract. Let’s talk about an actual person.
We’ll talk about Dave Parker’s 1986 season.
The reason why I’m bringing his season up is because of this post on Sean Smith’s Baseball Projection website. Here’s the premise, taken from an old “Hey Bill” question on Bill James’ website:
Okay, let’s slow things up a bit before we get into Smith’s response.
Dave Parker almost missed the 1986 season due to a drug suspension.
This, umm, was kind of a big deal:
Parker was able to make the payment, pass the test, and give the community service, all of which allowed him to play in 1986. He played in all 162 games, putting up a .273 / .330 / .477 batting line with an OPS+ of 117 (for those somewhat sabermetrically inclined). As mentioned above, he drove in 116 runs. He was also an all star, won the silver slugger award, and finished 5th in the National League MVP race.
And, well, WAR apparently hates him.
Here’s how WAR rates Parker’s 1986 season:
Note that I had to export this into a spreadsheet due to how difficult it is to work with single season lines on Baseball Reference.
There are two quibbles that I have with this — two places where this contradicts Bill James’ totals referenced above. The first comes from how many runs Parker is credited with batting. I’m not going to go into much detail on that today, however. 22 runs above a replacement level is, well, a number — but at least I know I can go slowly and figure out how we’ve arrived at that number.
The bigger problem comes from Rfield, or the number of runs he is credited with as a fielder. That number is -17.
And that’s why you’ve got WAR showing All Star Dave Parker as barely above a replacement level player in 1986.
What Is Rfield?
Okay, so what is Rfield?
Good luck finding the answer to this one.
I went first over to Baseball Reference’s WAR Explained site.
From there I clicked on the WAR - Position Players page:
I’m fine with everything so far. Let’s go to Fielding Runs, which is what RField stands for.
Now, Baseball Reference is kind enough to explain that all seasons before 2003 use something called Total Zone Rating for its defensive calculations:
And this is where the problem starts.
This is a very vague description of how Total Zone Rating is calculated. There are no steps involved, no graphs, no charts, no description of what data was actually used from Retrosheet — nothing of the sort.
And, of course, Sean Smith (known as rallymonkey back in the good old days of Baseball Primer) is its creator. There’s a reason why I started this article off with Smith’s website.
I searched and searched on Baseball Reference. The closest to an explanation I could find for Total Zone Rating was this page:
Again, these are not explanations. These are extremely vague generalizations about how these numbers were arrived at.
If I’m reading this right, Smith is telling me that he went through the entire history of baseball on a play-by-play basis, making ex post facto judgments on how well defenders handled a play based on some combination of location data and each batter’s “career rate of outs by position.”
I’ll be blunt: the whole thing sounds bizarre.
And it gets worse, by the way.
Smith’s website contains a page on Defensive Efficiency Rating, one that apparently doesn’t come up much in these conversations. He doesn’t have a more insightful page on how Total Zone Rating is calculated, sadly. However, this page does include some further insight into the limitations of Total Zone Rating:
Now, Smith’s explanation is halting and cumbersome at best. This is what I understand from what is written here:
Total Zone Rating does not contain a fielding component for catchers and pitchers, since it’s too hard to figure out.
The purpose of this was not to correct or replace traditional fielding metrics (even though it essentially has replaced those for people who like to argue about baseball value).
Even if we know where the ball was hit, we’re still guessing on which fielders could have made a play on the ball.
If we don’t know where the ball was hit, it becomes “difficult to fairly compare players in the same league” — which I take to mean that it is difficult to figure out how to assign the blame for not making an out.
For really old seasons (you know, the ones that we tend to really care about), Smith makes assumptions based on the handedness of the batter who hit the ball, in the absence of any usable data.
Ladies and gentlemen, I present to you “the finest defensive metrics around.”
Trust Me, Bro
Next comes the part that makes me sick.
Nobody can explain how any of this works.
I mean that. I’m not the only one who has had this question. See this Reddit thread, for example:
Yep — silence.
Now, this question got an answer, at least:
We’ll talk about Baseball Info Solutions later — and, yes, I have many reasons to be skeptical. However, check out the tl;dr at the bottom of that answer. There’s your baseball equivalent of “don’t worry about it; trust me, bro.”
I thought I’d turn to Fangraphs for a better answer. Fangraphs has a much better organized page that explains WAR, and has a much more friendly explanation of Ultimate Zone Rating, which comes from Baseball Info Solutions (but which is still essentially proprietary, sadly).
This is what the page on Total Zone Rating looks like on Fangraphs:
Okay, so now we know that Parker was “awful” in 1986 - we finally have some context for that rating.
Sadly, though, the link to “TotalZone Data” just brings us back to the empty explanation Smith gave us earlier.
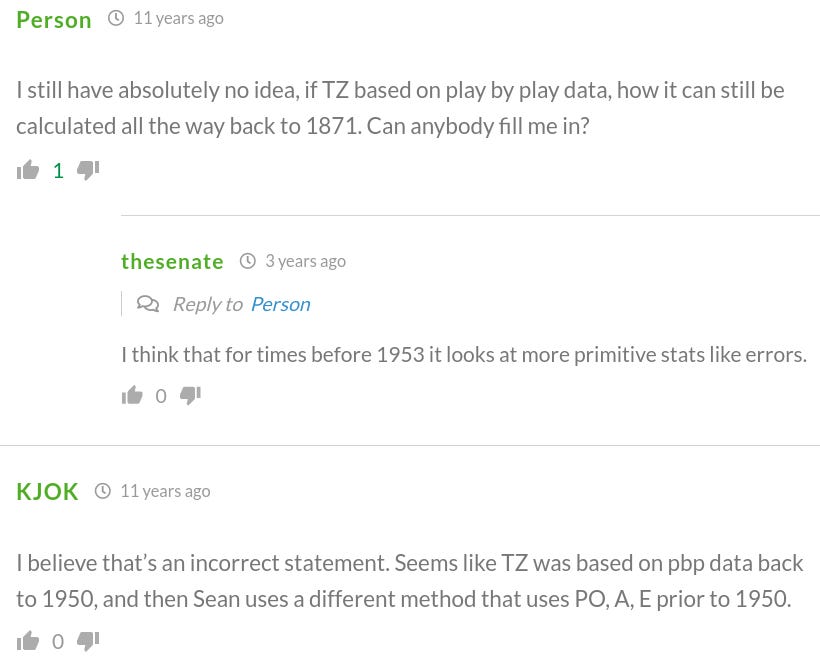
And, once again, there are interesting questions in the comments that have gone unanswered for years:
Again, that’s apparently scientific speak for “trust me bro.”
I mean, there are even people on Smith’s own blog (no new posts since 2010) who are begging to talk with him about his ratings:
Where’s the interaction? Where’s the openness?
Back to Parker
Okay, let’s go back to Parker.
Here’s what Smith had to say in response to Bill James’ criticism:
I’m upset about this answer.
Yeah, situational hitting is a thing. Maybe we should give credit for it, maybe we shouldn’t. Honestly, I don’t think anybody cares enough to want a WAR interface that takes into account RBIs or WPA or whatever. I think most of us are already sick and tired of these attempts to translate all possible baseball activity into a single number.
For the record, Parker gets a 2.8 WPA per Baseball Reference, crediting his efforts with almost 3 complete wins for the Reds. According to what Smith said above, that’s much closer to Win Shares’ interpretation of his season than what WAR says.
The difference here is defense. Why isn’t Smith talking about defense?
Sure, Parker was 35 in 1986. Yes, I know he went to Oakland in 1988 and became part of one of the greatest offenses in baseball history. I know he became a Designated Hitter. And it’s not a big surprise, either. He had a great arm in the late 1970s, but that sort of thing can diminish over time.
What Smith misses here, though, is the fact that Parker’s Rfield ratings (you know, the one that Smith developed using a formula that is apparently a state secret) aren’t consistent over time. Look at this:
When you think about baseball defense, do you think about players who are inconsistent like this from year to year? Do you think that it makes sense that a man who was generally recognized for strong defensive contributions would have 15 fielding runs in 1975, 25 in 1977, but 0 in 1976 and 1978? Without knowing how Rfield is calculated (since, as I just showed, it is shrouded in mystery), would you conclude that this is a stable and well defined metric?
Smith tells us that Parker was old and slow in 1986, which is why he had a -17 Rfield rating (which Fangraphs told us is “awful”). Why does this then change to only -10 in 1987? Why was it +5 in 1985? Did he become old overnight due to the drug scandal, and then get younger in 1987?
Parker had 35 games in the field in 1988 for the Athletics — hardly a “full-time DH,” especially when you realize that he only appeared in 101 games all season. He committed 4 errors in those games, but apparently made enough mistakes on balls hit in his general vicinity to have a -4 Rfield rating.
I mean, that’s the problem with the whole metric. I look at the stats that are in front of me, I scratch my head a little, and I sort of make assumptions about what assumptions Smith might have made.
You know what would be cool? It would be really cool if Sean Smith would actually write out the steps that he took to come up with these ratings. We could play around with them, see what would happen if we made small changes here or there. We might even be able to improve the formula.
Instead, all we can do is trust the creator — and argue about the results.
It’s a made-up stat, guys. Keep fighting the good fight.


