Stolen Bases In National Pastime
APBA fans love to talk about “hit value” when it comes to play result numbers that result in singles. This idea comes from APBA’s pitching system, which restricts singles — in particular, those that come from play result numbers 7 through 10.
In National Pastime, however, every play result number from 7 through 11 is a base hit no matter what. There is no pitching system, which means that calculating the likely batting averages that a card will give you is actually pretty easy to do.
However, there are differences between the different single numbers — just as we saw with the power numbers:
The first and most obvious difference comes in play result numbers 10 and 11. Both of these play result numbers will result in stolen bases — though neither gives the batter a stolen base 100% of the time. This somewhat hastily constructed chart is a simplified look at how stolen bases work on the National Pastime boards:
None of these play result numbers cause a runner to be caught stealing, by the way. Caught stealing results only take place in the “unusual play result” range of 36 to 41, and only with runners on base:
Note that stolen bases and caught stealing results impact only the runner on base. In other words, there is no system in National Pastime to ensure that would be basestealers are caught at a realistic rate. One reason for this, of course, is because caught stealing was not an officially kept statistic in 1930. In fact, Clifford Van Beek couldn’t have found this statistic for both leagues even if he compiled statistics by hand from box scores, since caught stealing was not a statistic reported in box scores at the time.
Now, you should also know that some of these play results numbers are quite rare:
Only 19 players received a single 41 on their cards, which means that the double steal that a 41 gives you with runners on first and third is extremely hard to come by.
Additionally, there are only 20 different 11s on the various National Pastime cards, and 65 different 10s.
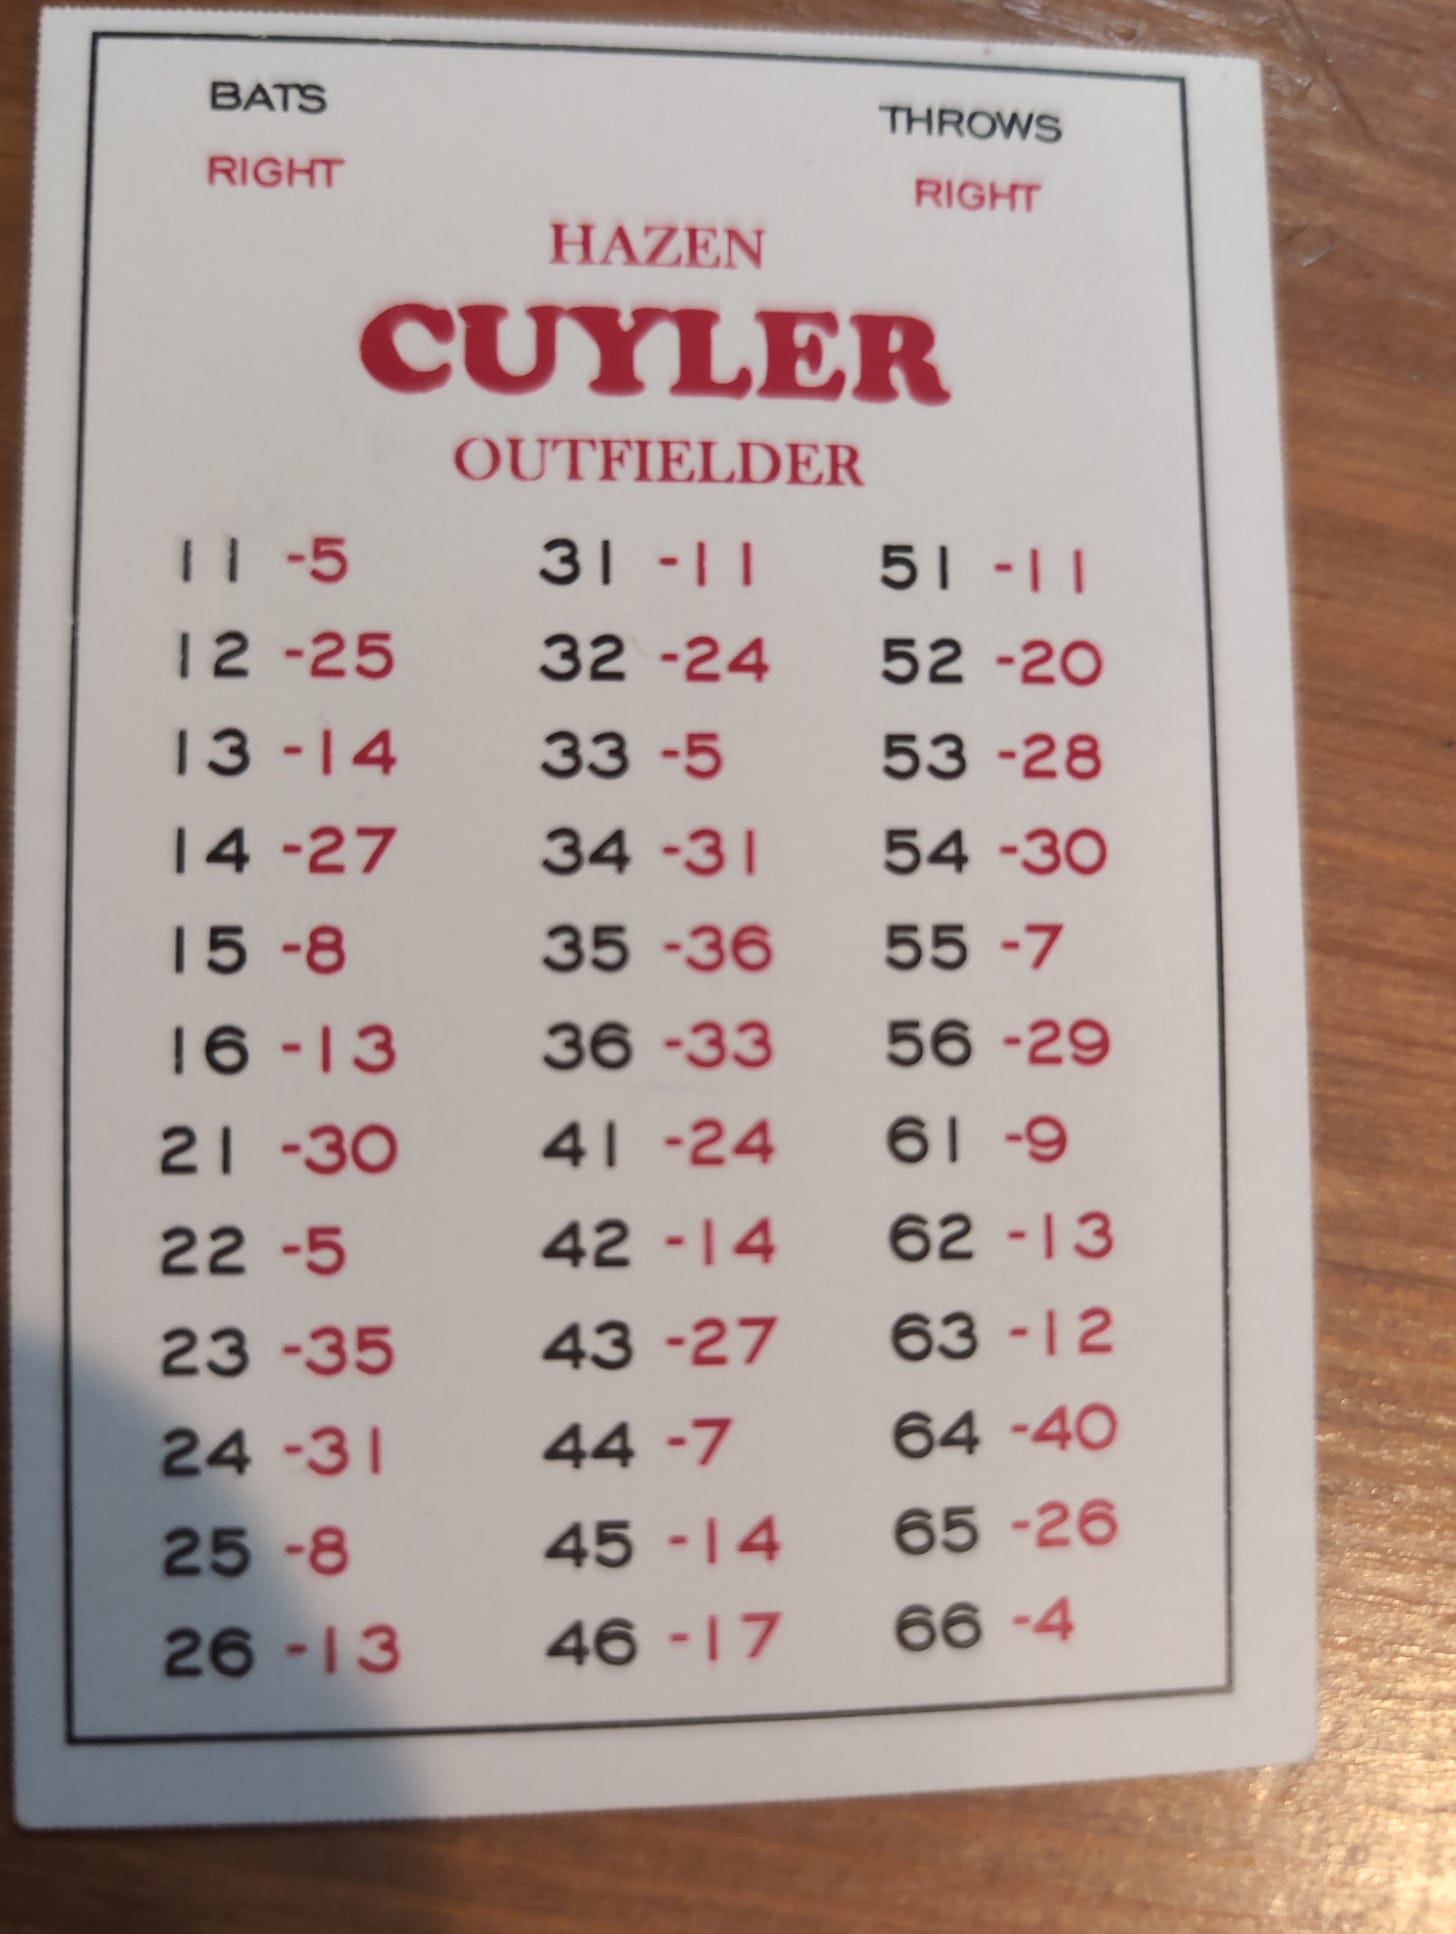
Hazen Cuyler of the Chicago Cubs is the only player with more than one 11 on his card:
Cuyler, who went by his nickname Kiki, stole 37 bases in 1930 — good enough to lead both leagues.
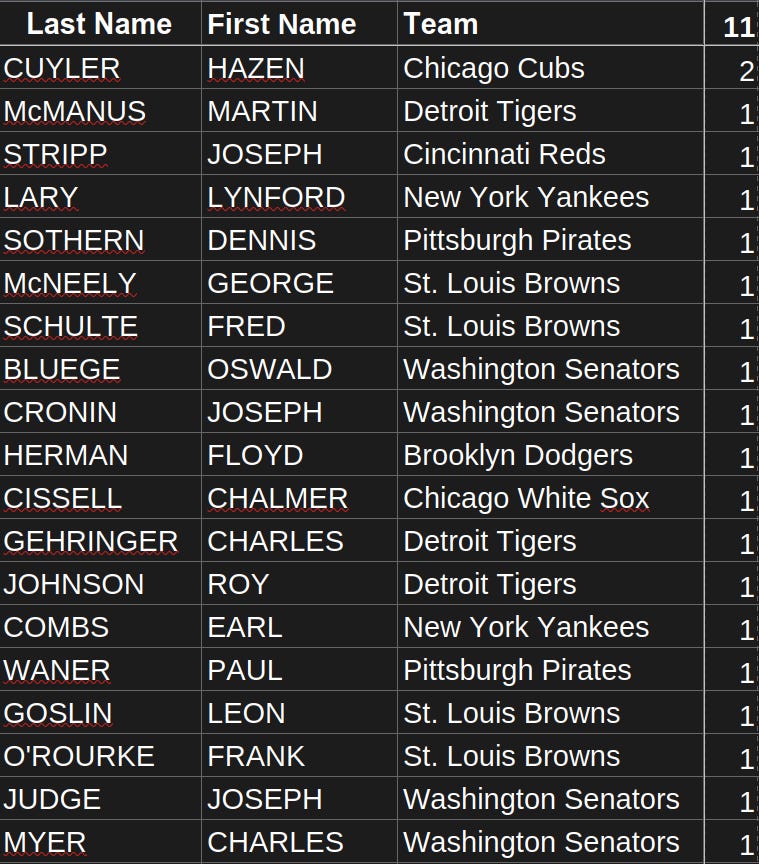
Here are all the players who managed to get a single 11 in National Pastime:
10s are a different story. You’ll notice that Cuyler did not receive a single 10 on his card to go along with his two 11s. In contrast, Martin McManus, who led the American League with 23 stolen bases, received a single 11 and two 10s — and was the only player to receive both an 11 and a 10:
51 different players received a 10. Here are all the players who received 2 10s:
Now, if you look at the stolen base values of play result numbers 10 and 11, you’ll notice something interesting:
11 is the only number of the two that results in a stolen base with the bases empty.
We looked a little over a year ago at the historical on base situations, which have stayed surprisingly consistent throughout the history of baseball:
These are the rough numbers we came up with — numbers, I might add, that remain relatively constant through both dead ball eras and high offense eras:
Bases empty — 55%
Runner on first — 20%
Runner on second — 8%
Runner on third — 3%
Runners on first and second — 7%
Runners on first and third — 3%
Runners on second and third — 2%
Bases loaded — 2%
Note that all of these numbers add up to 100%.
Now, using these numbers, we can simply add them together to calculate the “stolen base value” of play results 10 and 11. In other words, for a 10 we add .20 for a stolen base with a runner on first, .03 for a runner on third, and so on. This is a quick and dirty way to account for how frequently each of these base situations is likely to come up given historical numbers.
When we do this, we get .32 for play result number 10, and .90 for play result number 11.
2 out of Kiki Cuyler’s 36 play result numbers are 11s, which means he has a 2/36 or 1/18 chance of rolling an 11. Each of those rolls gives him 90% of a stolen base — not 100%, of course, since he’ll come up to bat now and then with a runner on 1st and 2nd or 1st and 3rd.
If you assume Cuyler gets 700 plate appearances (he had 741 in real life), you can calculate how many bases he’s expected to steal with his card. That would be 700 * 1.80 * (1/18). He’s got a 2 in 36 chance of rolling an 11, or 1 in 18 when we simplify the fraction. Those 11s are worth .90 stolen bases each, or 1.80 when we add them together. And 700 is the number of plate appearances we expect him to have.
In the end, we’d expect Cuyler to steal 70 bases in a National Pastime season — or about twice what he stole in real life.
We can do the same thing for McManus, though we’ll go a little bit faster. If McManus was given 700 plate appearances (and note that he only had 561 in real life), our calculus would be (700 * .90 * 1/36) + (700 * .64 * 1/18). That gives us about 42 stolen bases in 700 plate appearances.
If we restrict McManus to 541 plate appearances (no easy task, since we’ve only got 18 cards per team), we expect him to steal about 33 bases — much closer to the 23 he stole in real life.
Of course, there’s a chance that Van Beek used at bats, not plate appearances, for his calculations. Cuyler had 642 at bats; this gives him 64 expected stolen bases with those two 11s. McManus had 484 at bats; this gives him 29 expected stolen bases with one 11 and two 10s, which is very close to his real life total of 23.
Now, there are a few reasons why this approach might be wrong:
Clifford Van Beek likely did not know exactly how frequently base situations came up in real life baseball. Those who have studied the science behind APBA and similar games have traditionally used different estimates of how often each on base situation comes up.
The National Pastime boards likely will not result in on base situations that match real life exactly. This is very hard to calculate without actually playing through an entire season, since you need to estimate how often each batter will come to the plate in a season to see how likely it is for each base situation to arise — this kind of calculus is a little bit over my head at the moment.
There’s an outside chance that Van Beek just eyeballed it — which is honestly what I think he did with doubles and triples.
Remember, however, that Van Beek did have access to individual stolen base data at the end of the 1930 season, even before The Sporting News printed the official numbers in December:
Assuming that Van Beek used this chart or something similar, it would certainly be possible for him to roughly calculate the numbers of 10s and 11s each player card would need. He could also get the correct number of home runs for each player and the correct number of at bats. Each player card has at least one extra base hit number — an indication that Van Beek didn’t know the proper number of doubles and triples to give out — and Van Beek then likely used a combination of 14s (which are always walks) and “unusual play result” numbers 36-40 (which likely were intended to never count as at bats) to massage the batting averages a little bit.
While we don’t know exactly how Van Beek created these cards, we can get pretty close.


Thank you to a reader for discovering that I made a math error here. I inadvertently doubled the stolen base value twice: it should be 0.90, not 1.80.
I've fixed this in my spreadsheet, which now correctly shows that National Pastime stolen bases are quite accurate. Apologies for the mistake!