Creating Authentic National Pastime Cards
I considered for a little while creating some sort of guide to creating National Pastime cards in Clifford Van Beek’s style.
I’ve decided against it. This is in part because there are a lot of elements I don’t understand (such as how he assigned play result number 13). This is also in part because I wouldn’t want to take away the excitement of discovery from you.
It’s clear, however, that there is at least some demand for a system that would allow you to create your own cards. Van Beek published only 18 players per team, which makes any sort of 1930 season replay difficult. The temptation to homebrew extra players is pretty strong.
As such, here are a few guidelines that might help you in your journey.
Focus On Batting Average First
One thing that is clear to me is that the National Pastime engine was designed first and foremost to get players as close to their real life batting average as possible.
Play result numbers 1 through 11 are always base hits, no matter what. Additionally, play results 14 and 36 through 40 appear to have been designed to never charge at bats to the batter, no matter what (though this technically isn’t true based on the wording of the boards).
In other words, the number of base hit play result numbers (1 through 11) form the numerator of the batting average equation, or the part above the line in the fraction. The denominator, or the part below the fraction, isn’t 36: instead, it’s 36 minus the number of times 14 and 36 through 40 appear on the card. That gave Van Beek a sort of lever to fine tune his batting average calculations.
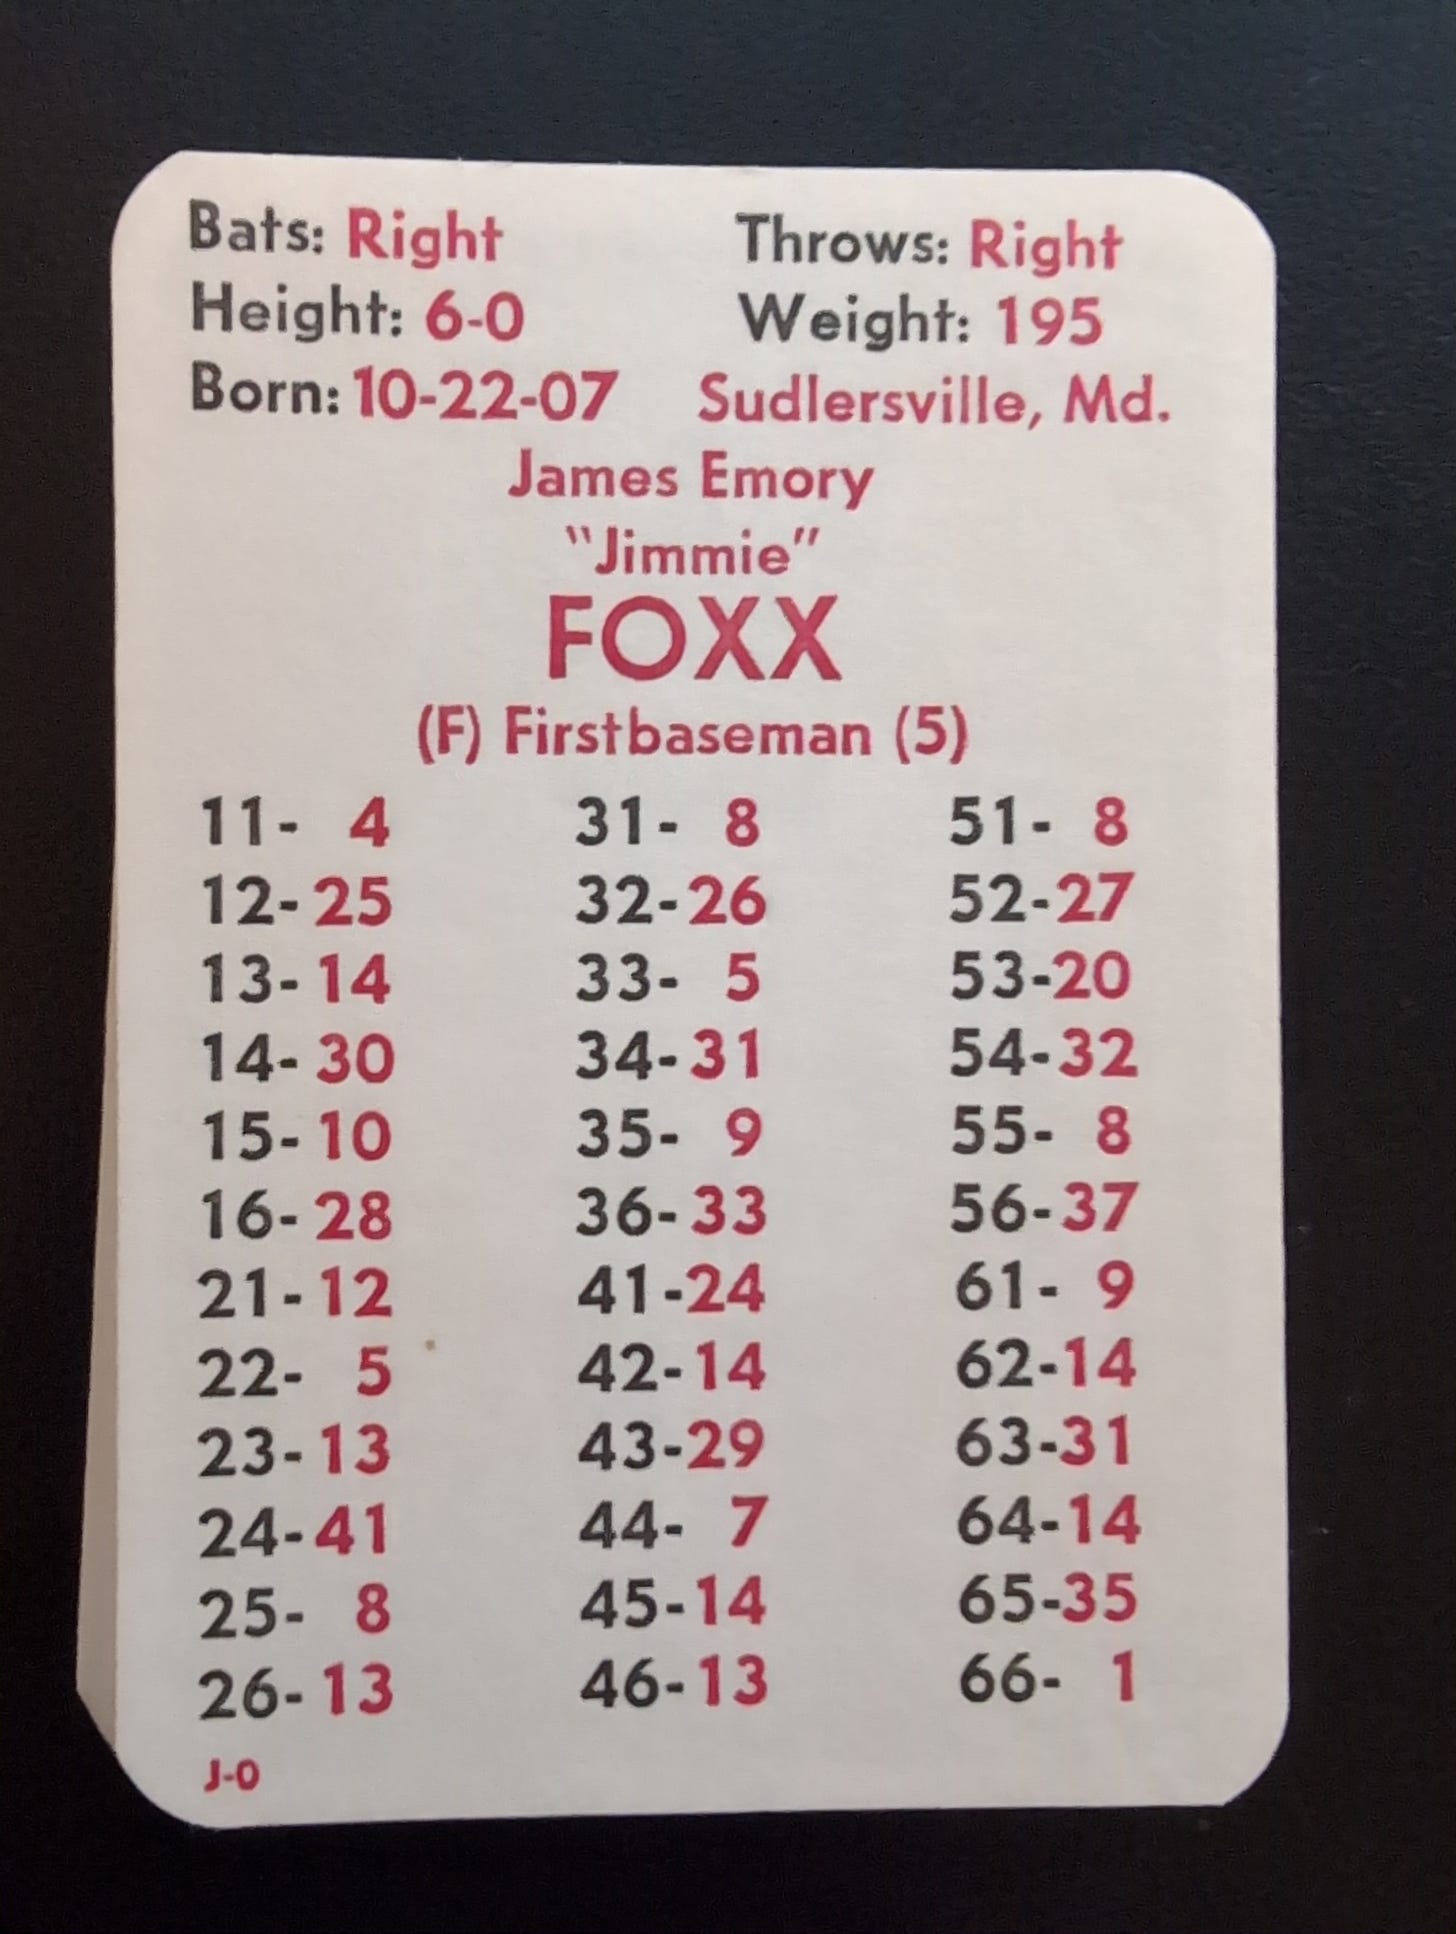
Let’s look at an example. Here’s Jimmie Foxx’s card — which, incidentally, is Foxx’s true “rookie card,” as I’m not aware of any earlier baseball card representation for him in existence.
Foxx hit .335 in 1930.
Van Beek assigned him 11 hit numbers. He’s also got three 14s and one 40. 36 minus 4 is 32, which means his expected batting average is 11/32, or .344.
Now, it’s pretty clear that Van Beek did not have access to the number of walks Foxx had in 1930, since those statistics were not officially published. Foxx walked 93 times in 674 plate appearances, or about 14% of the time. With only 3 14s, however, he’s goingn to walk about 8.3% of the time in National Pastime (3/36).
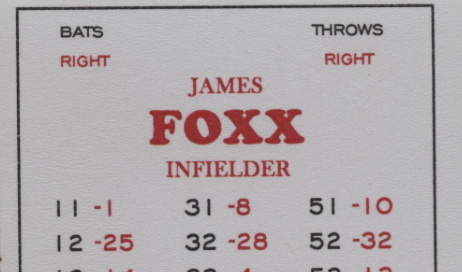
By the way, if we wanted to replicate Foxx’s real life walk total, we’d expect him to have 5 14s (5/36=13.89%). And that’s exactly what J. Richard Seitz gave him in APBA’s first printing of the 1930 season:
You’ll also notice that Seitz gave Foxx 12 hit numbers instead of 11. That’s because of APBA’s pitching system, which is a topic we’ll worry about later.
Anyway, when it comes to creating Van Beek style National Pastime cards, you’ll first want to figure out the right combination of hit numbers, walks, and “unusual play result numbers” to get the batting averages right.
Allocating Extra Base Hits
It’s not entirely clear to me how Clifford Van Beek allocated extra base hits. Remember that these are determined by hit numbers
Because the expected numbers of doubles, triples, and home runs tend to match each player’s real life total fairly well, I’ve got to assume that Van Beek was fully aware of the expected double, triple, and home run value of each extra base hit number.
I talked a little about that here:
To make a long story short, the general numbers you would need are as follows:
A 1 is always a home run. A 2 is almost always a triple, except in a single on base instance when it is a home run. And the other 4 play result numbers all have chances of being a double, triple, or home run.
I’m not entirely certain that this is the exact formula that Van Beek used to allocate extra base hit numbers. I do know that it’s close, however. If you use these numbers to predict the expected numbers of doubles, triples, and home runs from National Pastime cards, you’ll get extremely close to real life results.
Note, by the way, that play result numbers 4 and 5 are practically mirror images of each other.
Single Allocation
Play result numbers 7, 8, and 9 are all singles. 7 tends to be a “long” single that advances the runners more bases; an 8 is a “normal” single, and a 9 is usually described as an infield single.
I don’t know how these numbers were allocated. It seems to me that Van Beek may have given out more 7s than he “should have.” Part of this is because all players, including pitchers, have at least one 6 and one 7.
Most pitchers actually have two 7s, regardless of how well they hit in real life. Van Beek also was reluctant to assign any 9s to pitchers, as I describe in this post:
My advice for realistic card creation would be to start with a hit number baseline of 6-7-7 and work from there.
Out Allocation
Clifford Van Beek allocated out numbers based on two basic templates. Left handed hitters and switch hitters used this template:
Right handed hitters used this template:
I go into more detail about these templates in these two analytical posts:
Now, if you go back and count the blank spots in those sample cards, you’ll notice that there are a whopping 16 spots open for base hits. Not all of those will be filled with base hits, of course. These include numbers commonly used for 13s (always a strikeout) and 14s (always a walk).
When it came to assigning hit numbers, Clifford Van Beek used a priority system that remained consistent for the most part. Dice roll 66 always received the “best” result, followed by 11, and then 33. 22 and 44 came next, though it’s not clear which of those numbers was the “best,” or if Van Beek even bothered to come up with a system. Then came 55. It’s also common to find “good” outcomes on dice rolls ending with a 5 (15, 25, 35, 45, but not 65) or some dice rolls ending with a 1 (31, 51).
I wrote a bit more about this in this article:
Randomizing Out Results
Clifford Van Beek then randomized some out results. About 70% of National Pastime hitter cards feature randomized results.
It’s not clear if there was a system behind this randomization. Van Beek would take two or three different out dice roll numbers and simply swap the results. That’s one reason why analyzing these cards is so difficult: it’s almost like he deliberately obfuscated the pattern to prevent others from creating their own cards.
This phenomenon is what I call his “copy protection scheme:”
Other Considerations
All National Pastime players have a fielding position — either “infielder,” “outfielder,” “catcher,” or “pitcher.” This corresponds for the most part to the position the player most frequently played in real life. Of course, there’s really no fielding mechanism in the game, and there are no rules preventing players from playing in different positions. Without a pitching system, you’re technically free to do something crazy like have Rogers Hornsby be the starting pitcher for every Cubs game.
Van Beek assigned error numbers based on the number of errors each team gave up in real life. Teams that committed fewer errors had one or two more error play result numbers on their cards, which creates an illusion of fielding accuracy. More on that in this article:
Van Beek created a rudimentary stolen base system using play result numbers 10 and 11, both of which are singles. Play result number 10 has a stolen base value of .32; play result 11 has a stolen base value of .90. More on that in this article:
To understand how this works, let’s look at Foxx’s card again:
Foxx has a single 10 on play result number 51.
Jimmie wound up with 7 stolen bases in real life in 1930 out of 562 at bats, meaning that he stole a base 1.2% of the time. With a single 10, Foxx’s card gives him a 0.9% chance of stealing a base: that’s 1/36 times the 0.32 “stolen base value” of that single 10.
Again — I’m not certain that Van Beek used those exact stolen base values for play result numbers 10 and 11. However, using those numbers brings us extremely close to each player’s real life totals, which makes me suspect that he used something very similar.
Note that I used Jimmie’s at bats instead of plate appearances. This is because there is no evidence that Van Beek knew how many plate appearances each player had in 1930. Plate appearances was not a stat that was reported in the newspapers, and, as I’ve shown before, it’s clear that Van Beek didn’t know how many walks each player actually received in 1930 (those stats weren’t released until after Van Beek started selling National Pastime). However, if you use plate appearances instead of at bats in Foxx’s case, you wind up with 7 stolen bases in 674 plate appearances, or 1% — which is still extremely close to the 0.9% chance his National Pastime card gives him.
And, of course, if you look up you’ll notice again that APBA gave Foxx exactly one 10 in its original 1930 card set.


